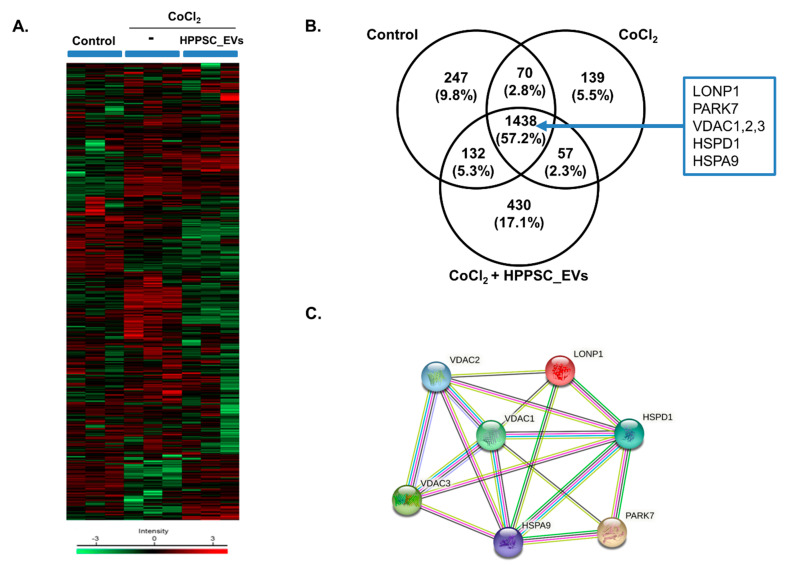
Figure 2.
Cluster analysis of differentially expressed proteins (DFEs) by HPPSC_EVs in hypoxia-damaged R28 cells. MaxQuant version 1.5.8.3 (www.coxdocs.org (accessed on 13 October 2022)) for label-free quantification (LFQ) was used to identify differentially expressed proteins in treated groups (CoCl2, and CoCl2 + HPPSC_EVs) and PBS-treated control cells. (A) Heatmap of differentially expressed proteins (p ≤ 0.05 and log2FC ≥ 1) in lysates of three groups (Control, CoCl2, and CoCl2 + HPPSC_EVs) analyzed by hierarchical clustering. High expression is shown in red; low expression is shown in green. (B) Venn diagram showing the number of proteins identified in proteomic analysis of each group in R28 cells. (C) Identification of protein–protein interaction of DEF in experimental groups of R28 cells.

