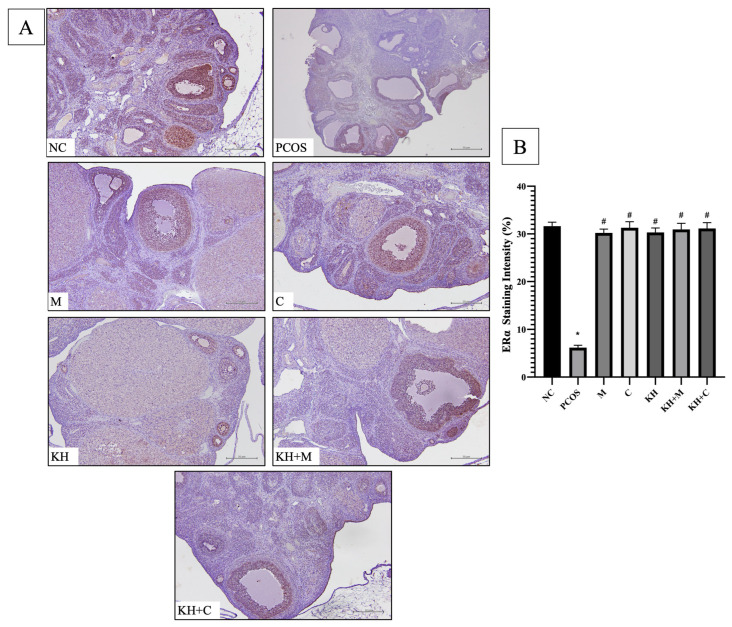
Figure 4.
(A) Representative images of ERα protein distribution and (B) quantitative analysis of ERα protein staining intensity in the treatment groups. The antibody-binding site of ERα is marked by the dark brown stain that is present in granulosa cells and theca cells of primary follicles, antral follicles, and preovulatory follicles. NC: normal control; PCOS: untreated PCOS; M: PCOS +metformin; C: PCOS + clomiphene; KH: PCOS + 1 g/kg/day of Kelulut honey; KH + M: PCOS + 1 g/kg/day of Kelulut honey + metformin; KH + C: PCOS + 1 g/kg/day of Kelulut honey + clomiphene. Scale bar = 50 μm. Magnification 100×, n = 6 per group. * p < 0.05 significance compared to the normal control group, # p < 0.05 significance compared to the untreated PCOS group. n = 6 per group.

