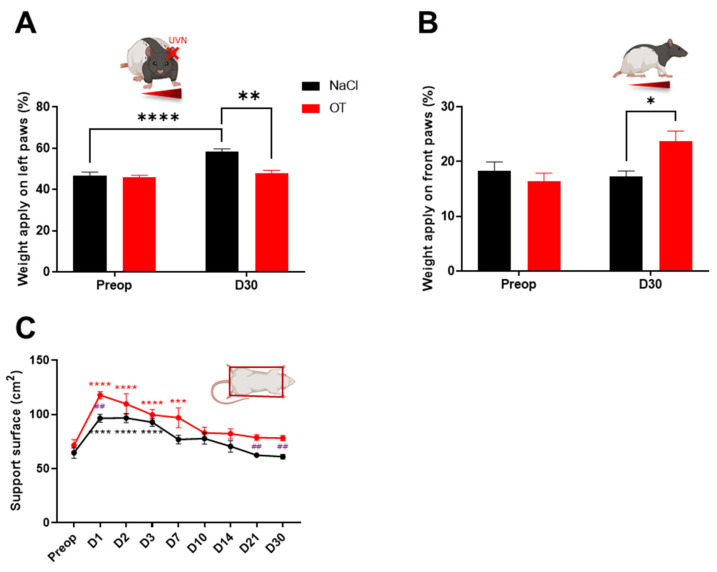
Figure 2.
Evaluation of postural and weight distribution of oxytocin-treated animals. (A) Assessment of weight distribution on the lateral axis at pre-operative (Preop) time and 30 days post-UVN in UVN-NaCl rats (black n=8) and UVN-OT rats (red n = 7). (B) Assessment of weight distribution on the anteroposterior axis at pre-operative (Preop) time and 30 days post-UVN in UVN-NaCl and UVN-OT rats. (C) Assessment of the support surface area in UVN-NaCl and UVN-OT rats. Error bars represent standard error of the mean (SEM). * p < 0.05, ** p < 0.01, *** p < 0.001, **** p < 0.0001. A significant difference from the preoperative value is indicated by * in black for the UVN-NaCl group and in red for the UVN-OT group. A significant difference between the UVN-NaCl and UVN-OT rats is indicated by # in purple.

