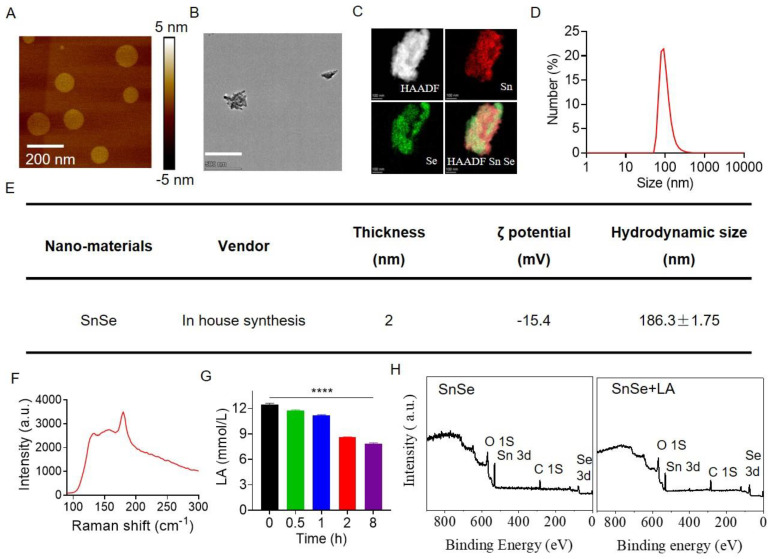
Figure 1.
Characterization and functional verification of SnSe NSs. (A) AFM image of SnSe NSs. (B) TEM images of SnSe NSs. Scale bar: 500 nm. (C) Elemental mapping of SnSe NSs. (D) The primary size of SnSe NSs measured by Nano Measurer. (E) Table showing the material characteristics analyses of SnSe NSs. (F) Depicts the Raman shift of the SnSe NSs. (G) Evaluation of lactate consumption at different time points after incubation with SnSe NSs. (H) Whole XPS patterns of SnSe NSs and SnSe NSs incubated with lactate. Data are means ± SDs. Statistical significance was calculated using one-way ANOVA followed by Tukey’s post-test. p-value: **** p < 0.0001. a.u., arbitrary units.

