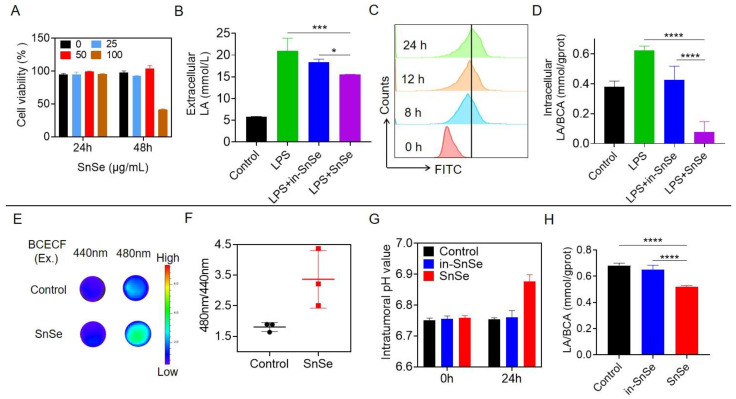
Figure 2.
Analyses of lactate consumption behaviors of SnSe NSs. (A) Cell viability of RAW 264.7 cells after treatment with various concentrations of SnSe NSs. (B) RAW 264.7-cell extracellular lactate levels under LPS treatments with the addition of SnSe NSs and in-SnSe NSs for 24 h. (C) Flow cytometric assay of cell uptake of SnSe NSs at different time points. (D) The evaluation of intracellular lactate levels in RAW 264.7 cells in the presence of LPS treatments after incubation with SnSe NSs and in-SnSe NSs for 24 h. (E) In vivo fluorescence imaging of tumor tissue supernatant injected with SnSe NSs after 24 h. (F) Semiquantitative analysis of pH fluorescence intensities based on the imaging data shown in (E). (G) Intratumoral pH value of tumors at 0 and 24 h post-intravenous injection of SnSe NSs and in-SnSe NSs. (H) The lactate consumption level after different treatments in vivo. Data are means ± SDs. Statistical significance was calculated using one-way ANOVA followed by Tukey’s post-test. p-value: * p < 0.05; *** p < 0.001; **** p < 0.0001. a.u., arbitrary units.

