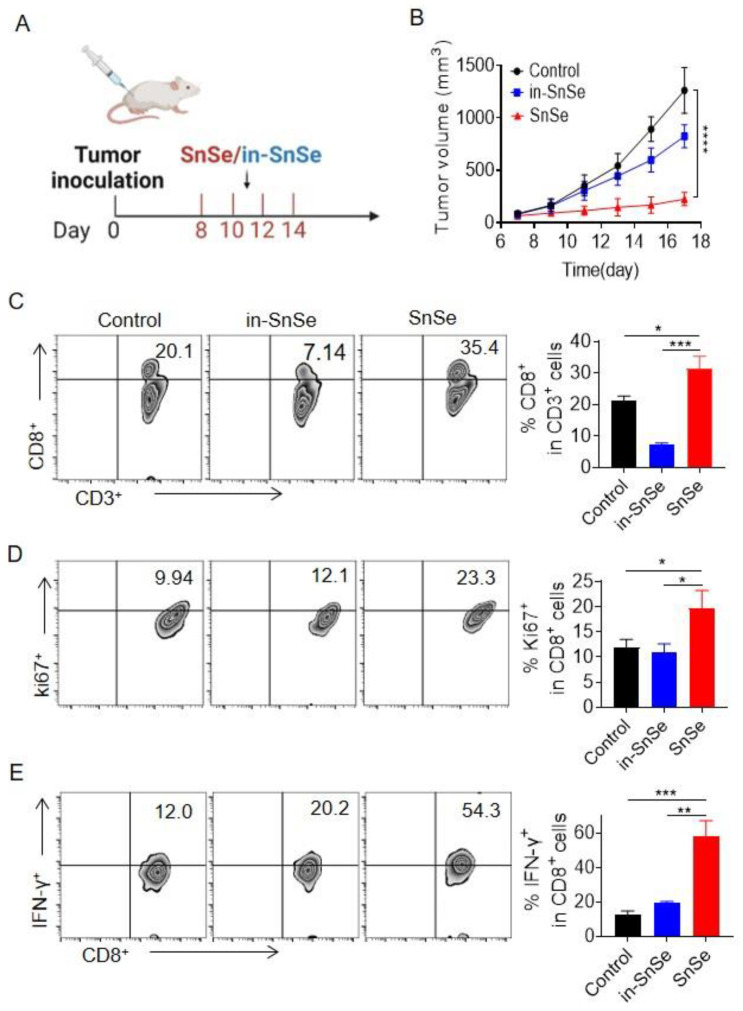
Figure 3.
Evaluation of the antitumor efficacy of SnSe NSs. (A) The treatment scheme of SnSe NSs or in-SnSe NSs. (B) The tumor growth curve in CT26 subcutaneous tumor mice with various treatments (n = 5). (C–E) Representative flow cytometry zebra plots and statistical analyses of immune cells in mice with different treatments. (C) CD8+ T cells. (D) Proportion of Ki67 within CD8+ T cells. (E) Quantitative measurement of IFN-γ+ within CD8+ T cells. Data are means ± SDs. Statistical significance was calculated using one-way ANOVA followed by Tukey’s post-test. p-value: * p < 0.05; ** p < 0.01; *** p < 0.001; **** p < 0.0001. a.u., arbitrary units.

