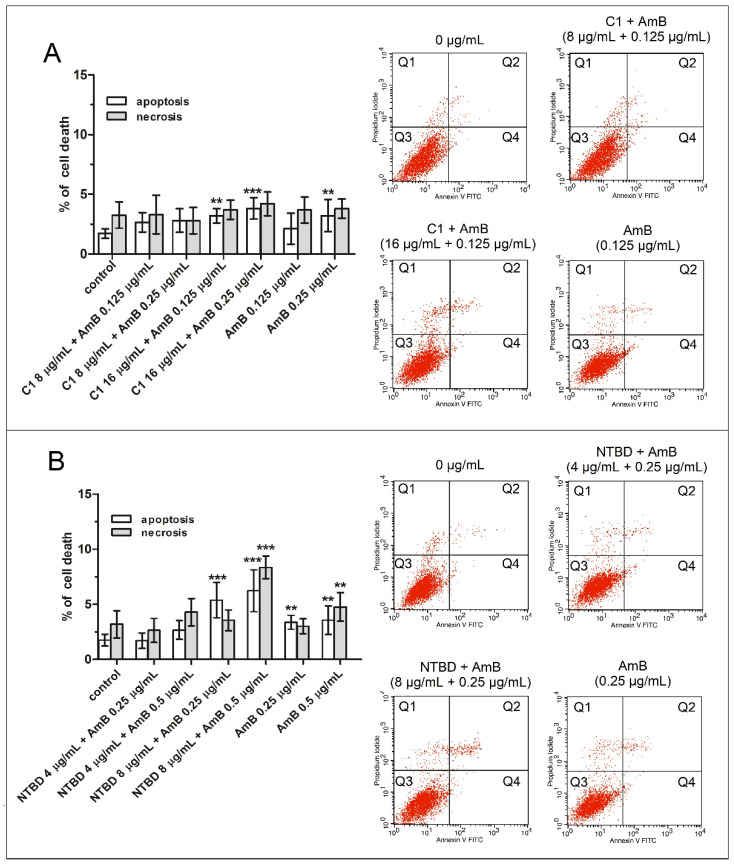
Figure 4.
Impact of the combinations of AmB with thiadiazoles C1 (A) or NTBD (B) on the induction of apoptotic and necrotic cell death in RPTECs. Following the 24 h treatment with or without a mixture of AmB with C1 or NTBD and with each of these compounds alone, the cells were double stained with Annexin-V/PI and analyzed with flow cytometry. Each red dot on the dot plots indicate single event/cell. Bar graphs show quantitative analyses of the percentage of apoptotic (early + late apoptosis) and necrotic cells. Values are significantly different from the vehicle control if p < 0.01 **, p < 0.001 *** in the one-way ANOVA test. Selected histograms from three independent cytometric measurements are presented on the right side of the graphs. Abbreviations: Q1—An-/PI+ necrotic cells, Q2—An+/PI+ late apoptotic cells, Q3—An-/PI- viable cells, Q4—An+/PI- early apoptotic cells.

