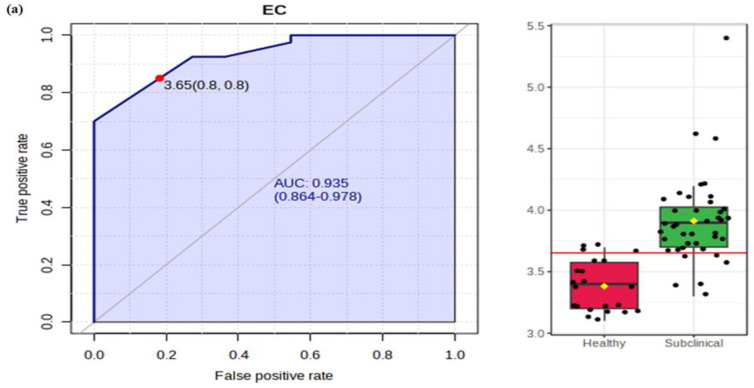
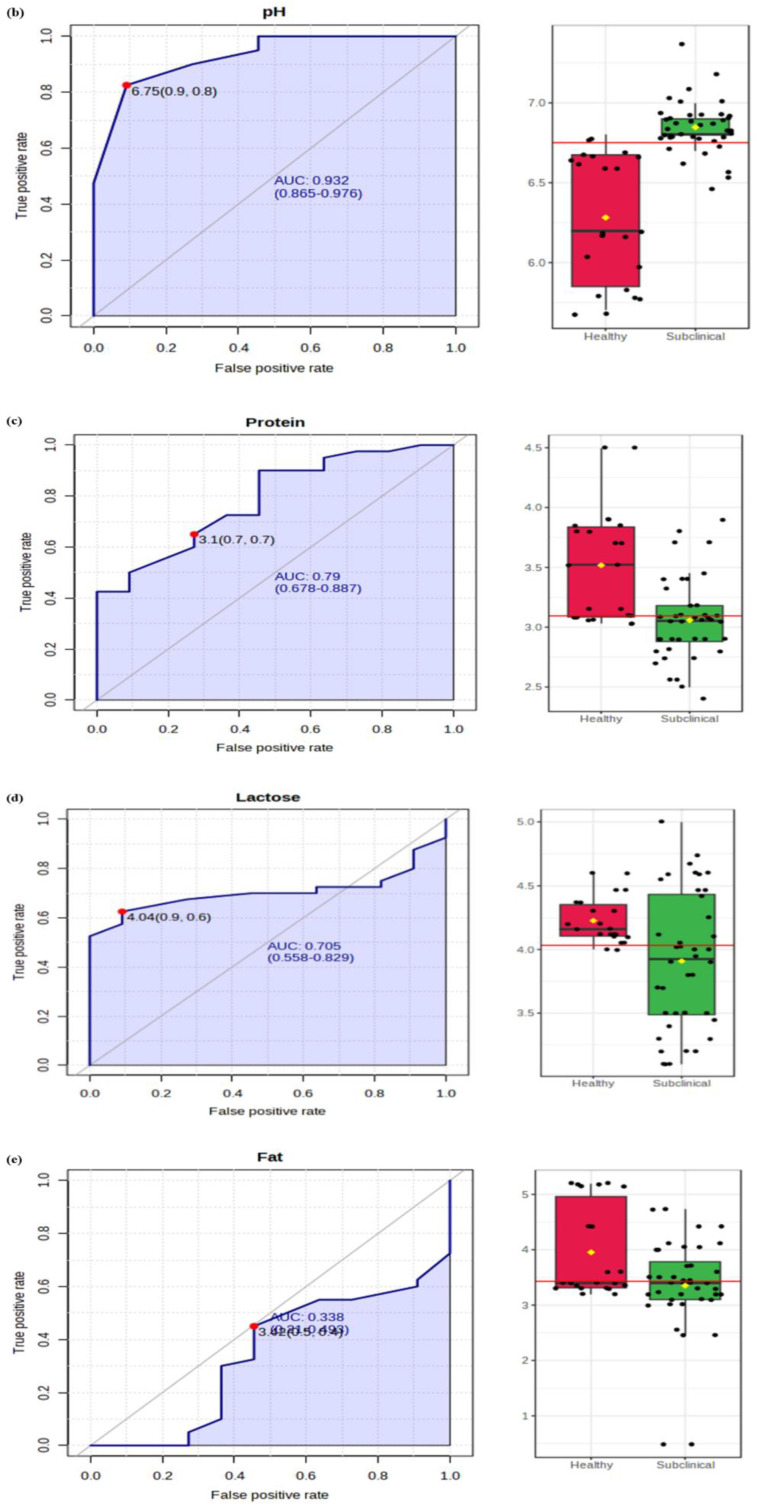
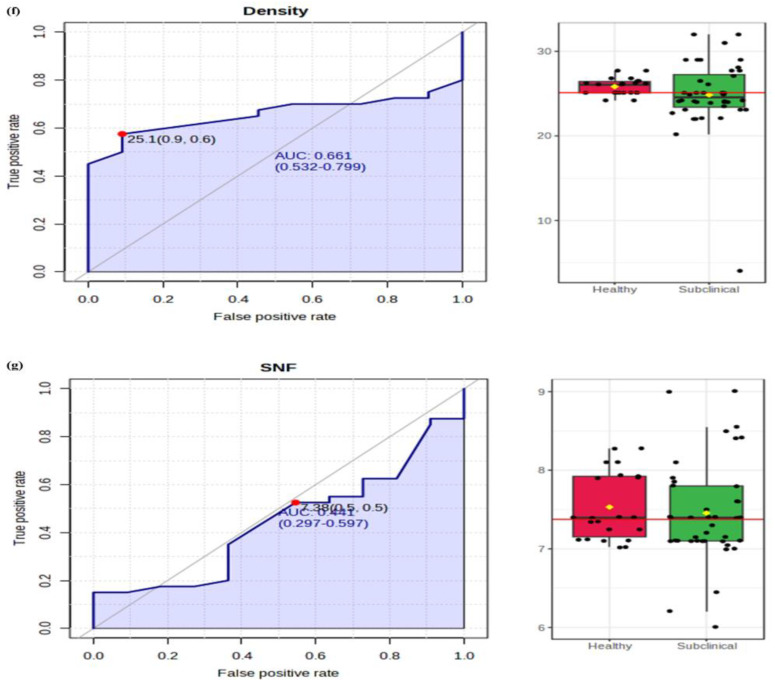
Figure 4.
Graphical summary distribution of milk chemistry; (a) EC, (b) pH, (c) protein, (d) lactose, (e) fat, (f) density, (g) SNF. The figure on the left shows AUC that represents the area under curve along with sensitivity (true positive rate) and specificity (false positive rate). The bar plots shown on the right indicate the original values (mean ± SD).


