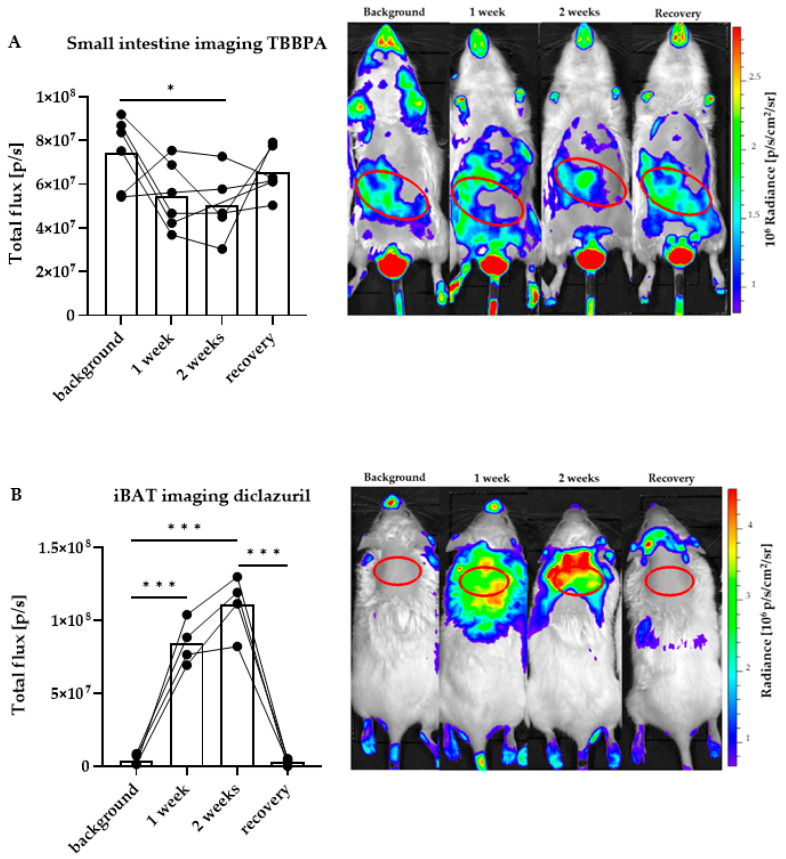
Figure 3.
Quantitation of local thyroid hormone action after disruptor treatment with in vivo imaging. Representative images and quantification in male THAI mice treated orally for two weeks with 150 mg/bwkg/day of TBBPA in corn oil containing 2% Et-OH, or 10 mg/bwkg/day of diclazuril as a saline suspension, followed by one week of recovery; (A) ventral in vivo imaging of TBBPA treatment; (B) dorsal in vivo imaging of diclazuril treatment. n = 4–6 mice/group; figure shows Tukey Box Plots, α = 0.05; *: p < 0.05, ***: p < 0.001.

