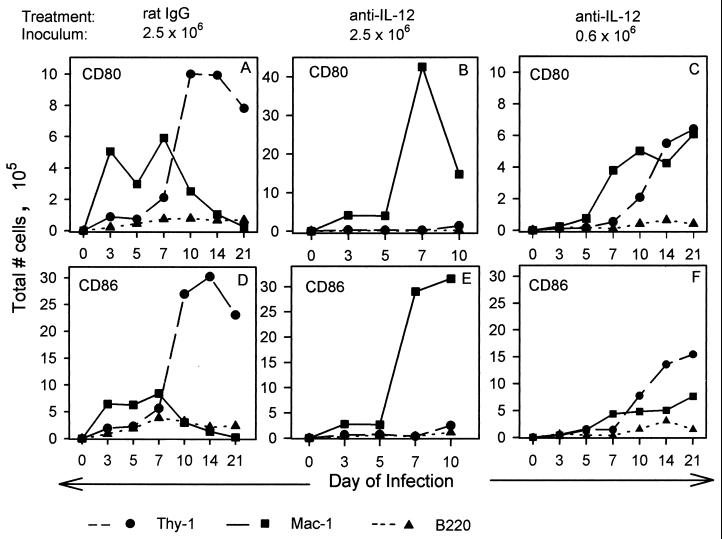
FIG. 5.
Lineage distribution of CD80+ and CD86+ lung cells. The expression of CD80 and CD86 on myeloid-lineage cells (Mac-1+), T cells (Thy-1+), and B cells (B220+) was determined by two-color immunofluorescence analysis. The data from two experiments were expressed as the mean of the total number of lineage-specific cells that coexpress CD80 or CD86 from lungs of naive mice (n = 5) and infected mice from days 3 to 21 of infection (n ≥ 6 per group). CD80+ lineage+ data (A, B, and C) and CD86+ lineage+ values (D, E, and F) were determined for rat IgG-treated mice infected with 2.5 × 10⁶ yeasts (A and D), mice given anti-IL-12 and 2.5 × 10⁶ yeasts (B and E), and mice given anti-IL-12 and 0.6 × 10⁶ (C and F).

