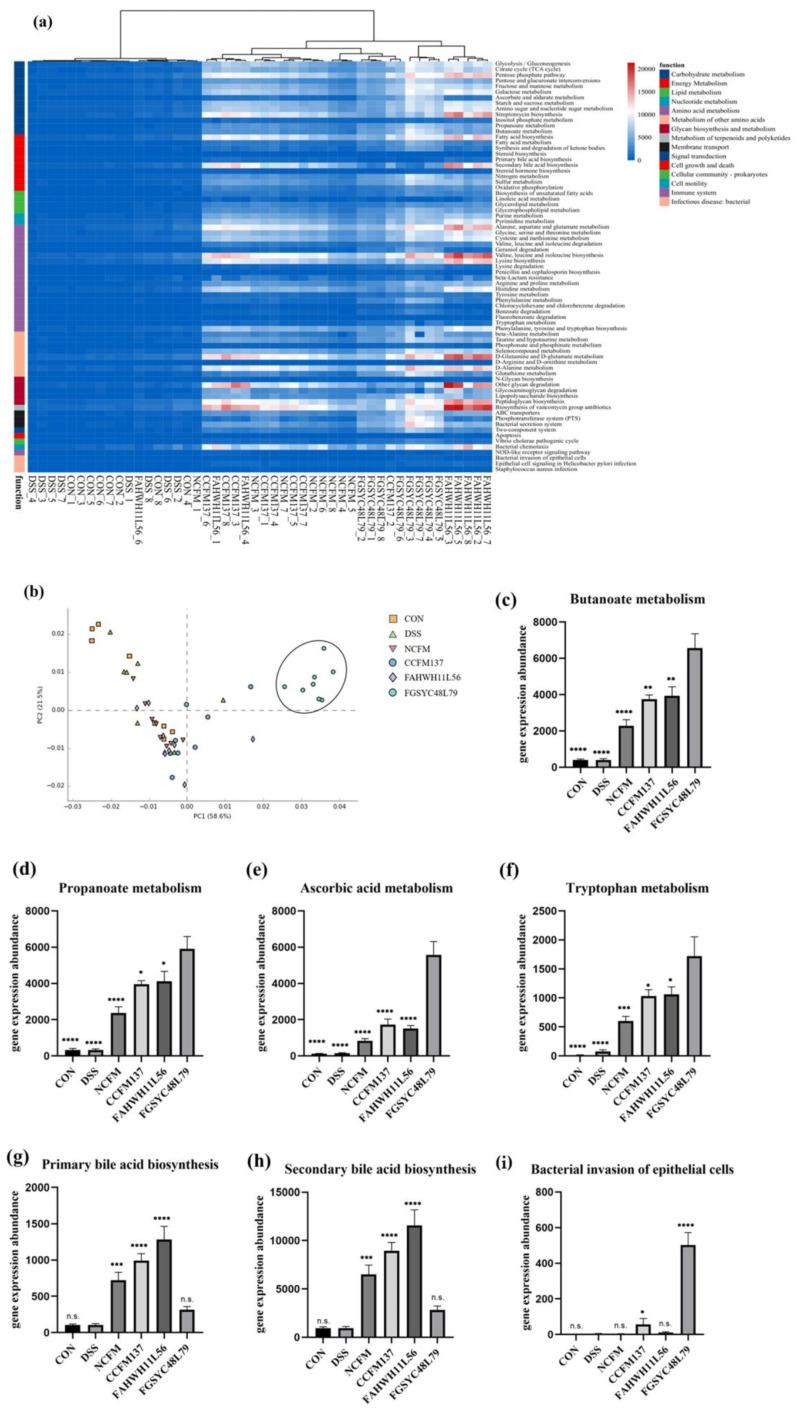
Figure 7.
PICRUSt analysis on gut microbiota after L. acidophilus intervention. (a) Heatmap of prediction on gut microbiota function, (b) PCA analysis of prediction on gut microbiota function, (c–i) predictive gene expression abundance of gut microbiota on butyrate metabolism, propionate metabolism, ascorbate metabolism, tryptophan metabolism, primary bile acid synthesis, and secondary bile acid synthesis of gut microbiota, and ability of bacteria to invade epithelial cells. *: p < 0.05. **: p < 0.01. ***: p < 0.001. ****: p < 0.0001. N.s.: no significant difference. All data are presented as mean ± standard error of the mean (SEM). In figure c–f, the FGSYC48L79 group was used as a reference. In figure g–i, the DSS group was used as a reference.

