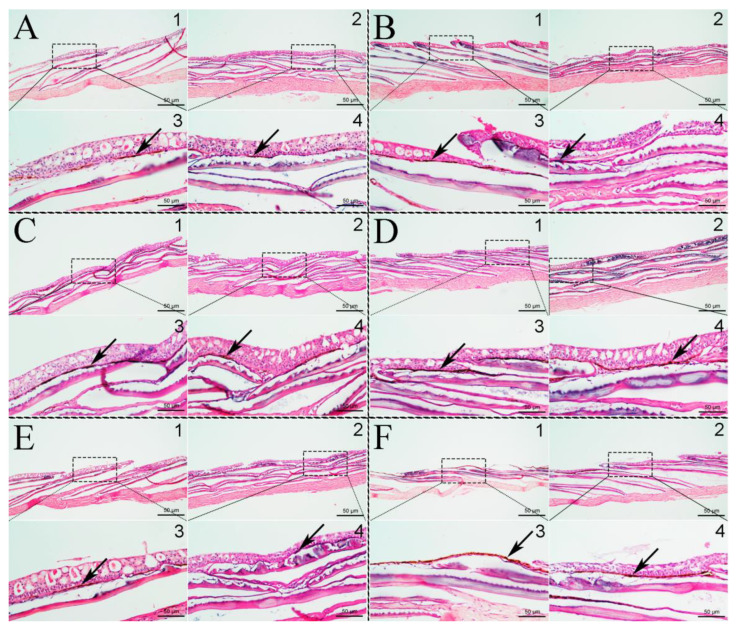
Figure 2.
Slice microstructure observation of melanin zone in dorsal and ventral skin of P. leopardus. (A): Initial group; (B): Blue group; (C): Red group; (D): Black group; (E): White group; (F): Transparent group. Black arrows indicate melanin. In the subfigures, 1 is the dorsal skin and 2 is the ventral skin. 3 is the local amplification of 1, and 4 is the local amplification of 2.

