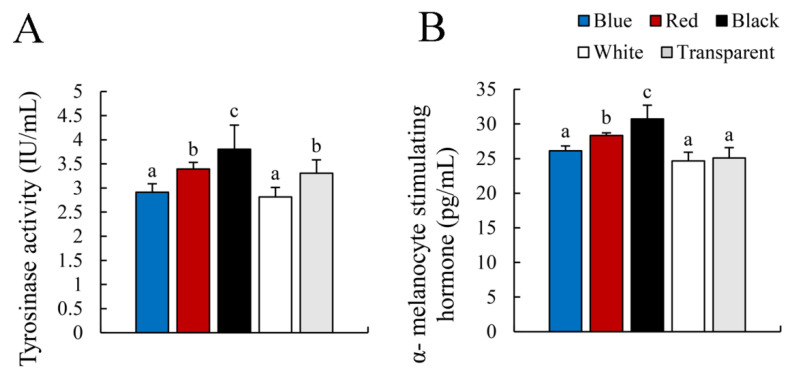
Figure 4.
Tyrosinase activity and α-MSH levels in serum. (A): Tyrosinase activity; (B): α-melanocyte stimulating hormone. Values are means ± standard error for ten replicates. Significant differences for means within experimental groups are indicated with different lowercase letters (p < 0.05, n = 9).

