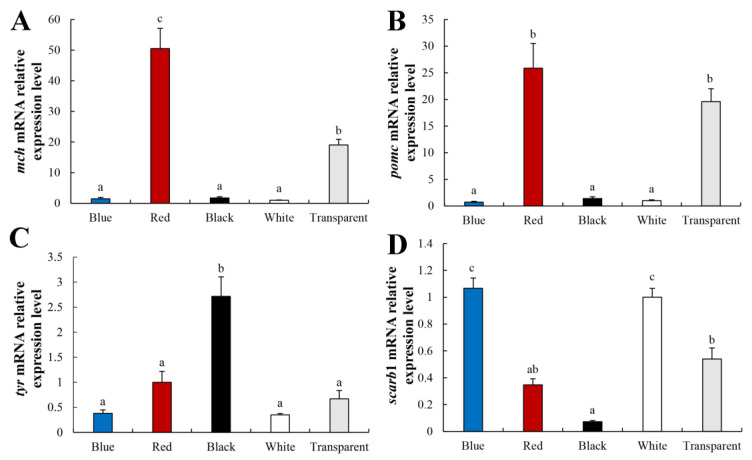
Figure 5.
The expression levels of mch (A), pomc (B), tyr (C), and scarb1 (D) in P. leopardus skin for different color. Values are means ± standard error for ten replicates. Significant differences for means within experimental groups are indicated with different lowercase letters (p < 0.05, n = 9).

