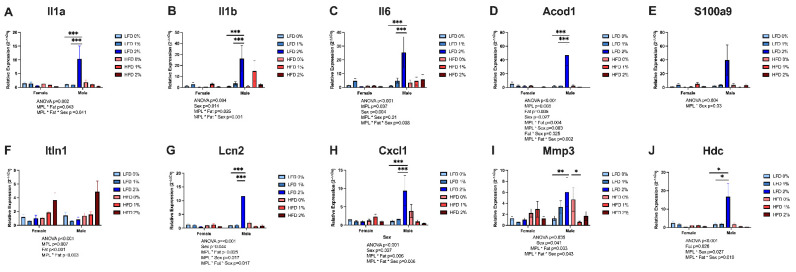
Figure 4.
Effect of MPLs on colon gene expression. Colonic RNA gene expression was determined using real-time qRT-PCR and standardized to the geometric mean of Gapdh, Actb (β-actin), and Rplp0 reference genes using the 2−ΔΔCt method. (A) Interleukin (IL)-1α (Il1a), (B) IL-1β (Il1b), (C) IL-6 (Il6), (D) aconitate decarboxylase (Acod1), (E) S100a9, (F) intelectin 1 (Itln1), (G) lipocalin 2 (Lcn2), (H) CXC motif chemokine receptor 1 (Cxcl1), (I) matrix metallopeptidase 3 (Mmp3), and (J) histidine decarboxylase (Hdc). Values are reported as mean ± standard error of the mean, n = 4–7/group. * indicates p-value < 0.05, ** indicates p-value < 0.01, and *** indicates p-value < 0.001 using three-way ANOVA with Fisher’s least significant difference for multiple comparisons.

