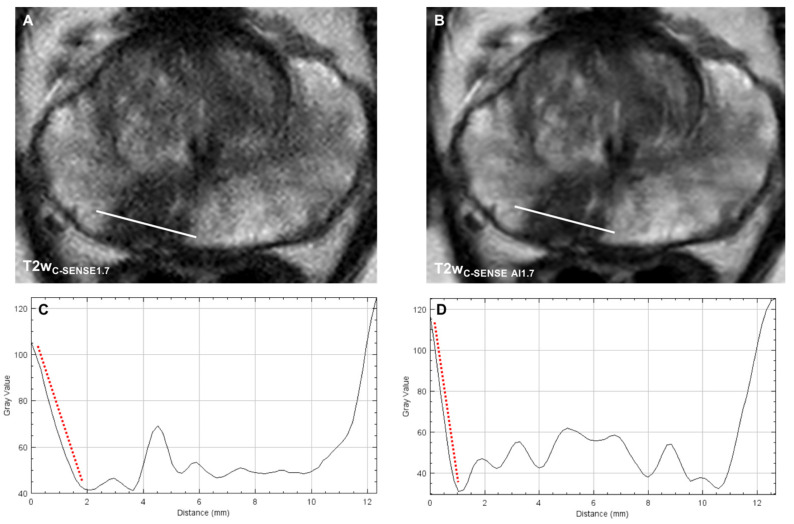
Figure 3.
Axial T2w images of a PI-RADS 4 lesion acquired with the standard-of-reference (A) and the DL-enhanced study sequences (B). The line profile plots of the indicated location demonstrate a significantly steeper signal change at the border of the lesion in the T2wC-SENSE AI1.7 (C) compared to the T2wC-SENSE1.7 (D) indicating a sharper lesion demarcation.

