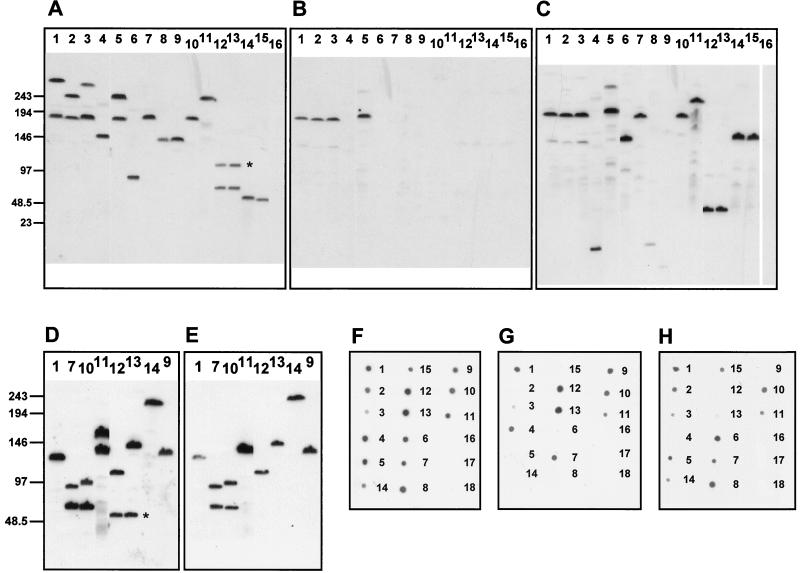
FIG. 5.
Southern analysis of pulsed-field gels of SpeI-digested chromosomal DNA (A to E) and DNA dot blot analysis (F to H) of regions 2 and 3. The numeration of bacterial strains is the same in all panels: 1, subgroup IV-1; 2, subgroup I; 3, subgroup III; 4, subgroup IX; 5, subgroup VI; 6, A4 cluster; 7, lineage 3; 8, ST30; 9, ST49; 10, ST48; 11, ST25; 12, ET-5 complex (44/76); 13, ET-5 complex (MC58); 14, ET-37 complex (FAM18); 15, ET-37 complex (ROU); 16, N. gonorrhoeae FA1090; 17, N. lactamica Z6793; 18, N. lactamica Z6784. (A to C) Southern analysis of region 3 with probes corresponding to rth18 (A), rth33 (B), and gpxA (C). Results identical to those shown in panel A were obtained with probes for rth17 and rth19. Hybridization with probes for rth20 and rth21 resulted in a similar pattern except for lanes 12 and 13, where the upper signal (marked by an asterisk) disappeared. The same results as in panel B were obtained with probes for rth1, rth4, rth28, and rth30. The other ORFs of Pnm1 were not tested by Southern analysis, but similar results can be expected according to dot blot analysis except for rth26, which is also present in strains of the ET-5 complex, ST25, and ST48. (D and E) Southern analysis of region 2 with probes for fhaC (D) and rtw7 (E). The same results as in panel D were obtained with probes for fhaB (5′-part), rtw2, and rtw4. With a probe for rtw5, the lower signals in lanes 12 and 13 (marked by an asterisk) disappeared. The result of hybridization with a probe for rtw8 was the same as with rtw7 (E). Positions of the molecular size markers are shown in kilobases. (F to H) DNA dot blot analysis with probes for the 5′ end (F), the central part (G), and the 3′ end (H) of fhaB.

