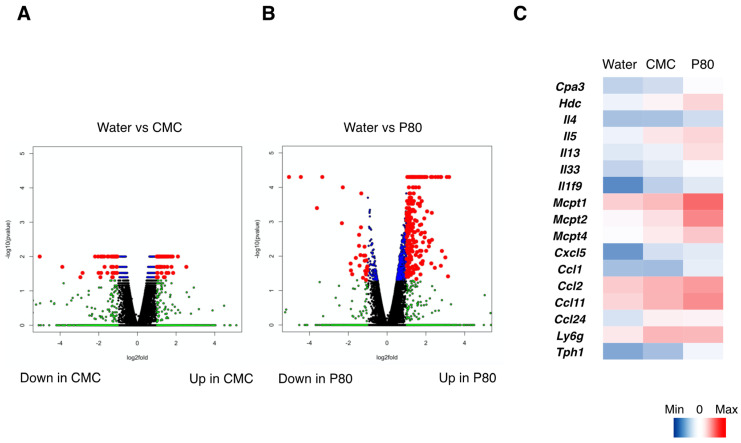
Figure 4.
RNA-seq analysis of colonic CD45+ immune cells derived from the mice with food allergy. (A) Volcano plots presenting log2 fold-change of gene expression (X axis), and log10 fold-change of gene expression (Y axis) in CMC-treated mice as compared with water-treated mice. Blue dots correspond to the genes with a p value < 0.05 between CMC-treated and water-treated mice. Green dots correspond to the genes with at least a 2-fold-decreased or 2-fold-increased abundance in CMC-treated mice compared to water-treated mice. Red dots correspond to the genes with at least a 2-fold-decreased or 2-fold-increased abundance in CMC-treated mice compared to water-treated mice and a p value < 0.05. (B) Volcano plots presenting log2 fold-change of gene expression (X axis), and log10 fold-change of gene expression (Y axis) in P80-treated mice as compared with water-treated mice. Blue dots correspond to the genes with a p value < 0.05 between P80-treated and water-treated mice. Green dots correspond to the genes with at least a 2-fold-decreased or 2-fold-increased abundance in P80-treated mice compared to water-treated mice. Red dots correspond to the genes with at least a 2-fold-decreased or 2-fold-increased abundance in P80-treated mice compared to water-treated mice and a p value < 0.05. (C) Heatmaps showing the gene expressions related to mast cell activation and type 2 immune responses.

