Figure 1.
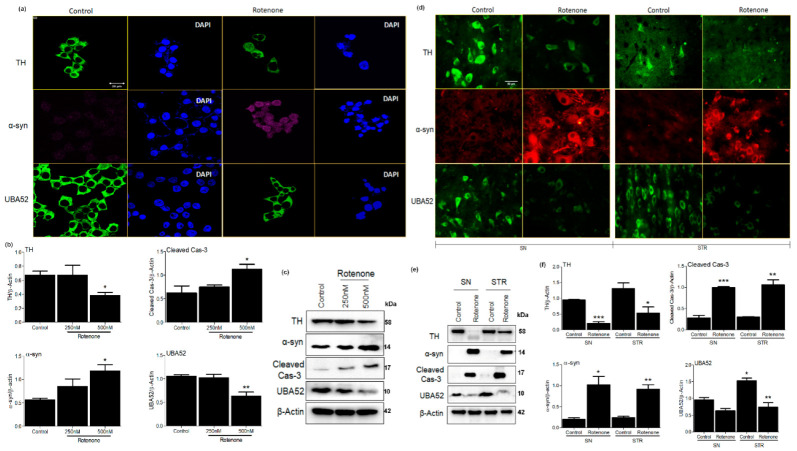
Parkinson’s disease markers and UBA52 expression in SHSY5Y and rat brain. (a) Confocal microscopy images depicting expression of TH, α-syn and UBA52 after secondary labeling with Alexa fluor -488 (green) and -546 (red), -647 (pink) in control vs. rotenone treated SH-SY5Y cells; n = 3. (b,c) A graphical and pictorial illustration of Western blot performed to assess the expression of TH, α-syn, cleaved cas-3 and UBA52, normalized against β-Actin in human SH-SY5Y neuroblastoma cells; n = 3. (d) Florescent images depicting the expression of TH, α-syn and UBA52 after secondary labeling with Alexa fluor -488 (green) and -546 (red) in control vs. rotenone treated SH-SY5Y cells, scale bar: 50μm; n = 3. (e) Immunoblot images illustrate the protein level of TH, α-syn, cleaved cas-3 and UBA52, normalized against β-Actin in rat brain regions. (f) Graphical representations of Western blot images normalized against β-Actin in SN and STR rat brain regions indicate a similar pattern as observed in SHSY5Y cells; n = 3. Quantifications are the mean and SEM of at least three independent experiments, and statistical analyses were performed using Student’s t-test and one-way ANOVA. * p < 0.05, ** p < 0.01, *** p < 0.001 control vs. Rotenone.

