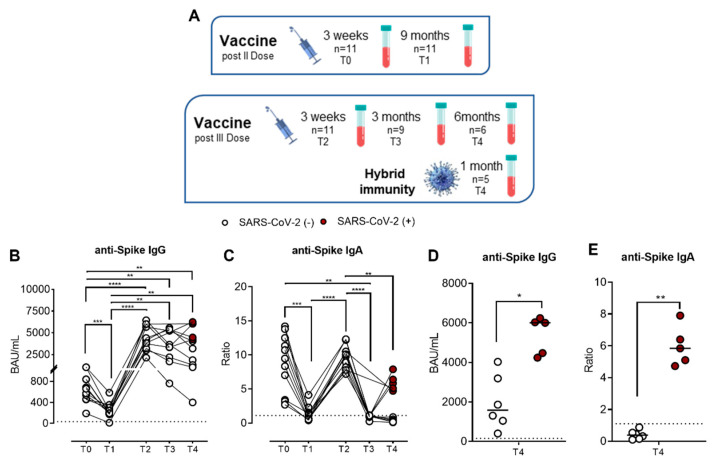
Figure 1.
Kinetics of total anti-SARS-CoV-2 IgG and IgA serum antibody levels (n = 11) of the Pfizer-BioNTech BNT162b2 mRNA-based vaccination in immunocompetent (IC), healthy subjects. (A) Schematic timing of sampling for the evaluation of the humoral response to the vaccine in our studied cohort. Both serum antibodies were evaluated three weeks (T0) and nine months (T1) after the second dose and three weeks (T2), three months (T3), and six months (T4) after the third booster dose for uninfected subjects or one month after a SARS-CoV-2-negative swab for infected subjects. Vaccinated subjects who contracted SARS-CoV-2 infection during the follow-up (n = 5) are indicated as SARS-CoV-2 (+) (red dots), whereas uninfected subjects (n = 6) are as SARS-CoV-2 (−) (white dots). (B) Anti-SARS-CoV-2 S1/S2 IgG levels and (C) anti-SARS-CoV-2 S1 IgA levels at T0, T1, T2, T3, and T4. (D) Comparison of anti-SARS-CoV-2 S1/S2 IgG levels and (E) anti-SARS-CoV-2 S1 IgA levels at T4 between vaccinated SARS-CoV-2 (+) and SARS-CoV-2 (−) subjects (n = 6). The dotted lines correspond to IgG (>33.8 BAU/mL) and IgA (>1.1 Ratio) cutoff, respectively. The significance was determined using Tukey’s multiple comparisons test, one-way ANOVA, Mann–Whitney test, and t-tests; * p < 0.0332; ** p < 0.0021; *** p < 0.0002; **** p < 0.0001.

