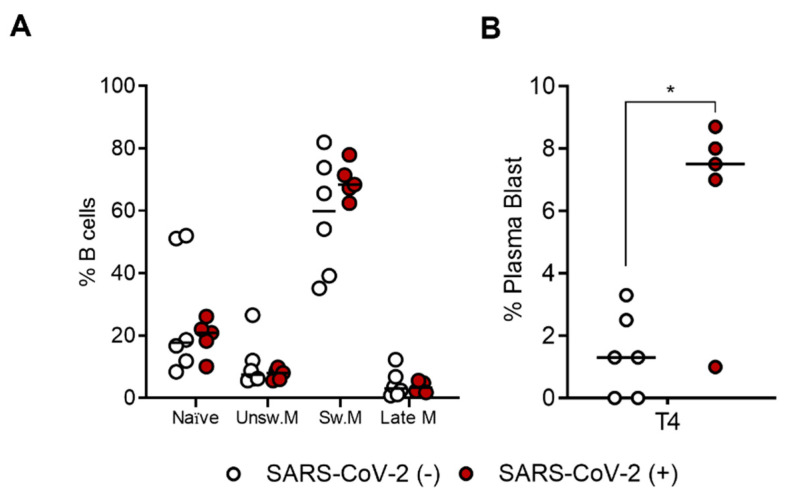
Figure 5.
Comparison of SARS-CoV-2-specific B-cell subpopulations between recovered SARS-CoV-2 (+) (n = 5) and uninfected SARS-CoV-2 (−) (n = 6) vaccinated subjects at T4. (A) Percentage (%) of each SARS-CoV-2-specific B-cell subpopulations (naïve, IgD+CD27−; unswitched memory, IgD+CD27+; switched memory, IgD−CD27+; and late memory, IgD−CD27−) at T4 in both uninfected (white dots) and recovered subjects (red dots). (B) Percentage (%) of plasma blast (CD27highCD38high) in both uninfected SARS-CoV-2 (−) and recovered SARS-CoV-2 (+) subjects at T4. Significance was determined using the Mann–Whitney test and t-tests, * p < 0.0332.

