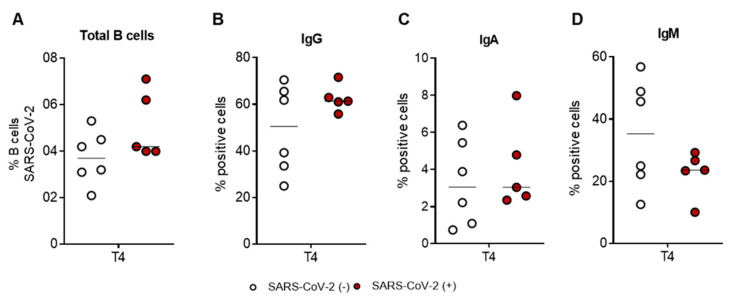
Figure A1.
Percentage (%) of SARS-CoV-2-specific B cells between uninfected SARS-CoV-2 (−) (n = 6) and recovered SARS-CoV-2 (+) (n = 5, red dots) vaccinated subjects six months (T4) after the third booster dose (A). Comparison of the percentage (%) of positive cell-to-surface immunoglobulin isotypes IgG (B), IgA (C), and IgM (D) at T4. SARS-CoV-2 (−) are uninfected subjects (white dots), and SARS-CoV-2 (+) are recovered (red dots) vaccinated subjects. Significance was determined using Mann–Whitney test and t-tests.

