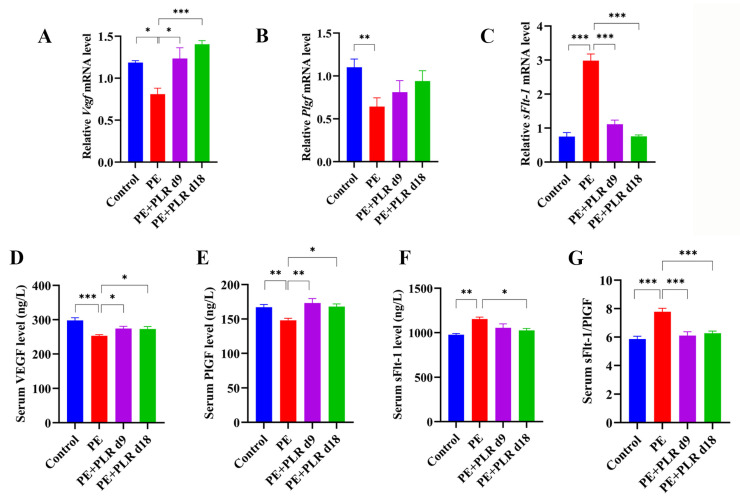
Figure 2.
PLR reversed the angiogenic imbalance in PE mice. (A–C) Relative mRNA levels of Vegf, Plgf, and sFlt-1 in placenta. (D–F) Serum levels of VEGF, PlGF, and sFlt-1 were measured by ELISA. (G) The ratio of sFlt-1 and PlGF was calculated using ELISA results. For (A–C), n = 6 for each group. For (D–G), n = 8 for each group. Data are expressed as the mean ± SEM. * p < 0.05, ** p < 0.01, *** p < 0.001 (ANOVA test).

