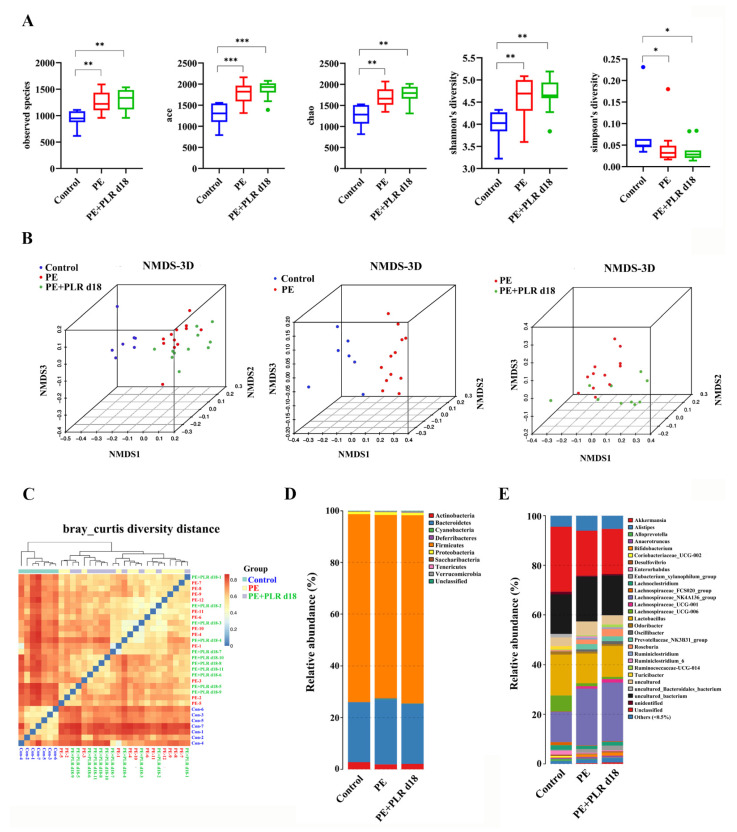
Figure 6.
PLR affected the composition of gut microbiota in PE mice. (A) α-Diversity analysis including the observed species, Ace, Chao, Shannon, and Simpson indexes. β-Diversity analysis including the nonmetric multidimensional scaling (NMDS) (B) and heatmap (C) based on the Bray–Curtis diversity distance. (D,E) Relative abundance at the phylum level and genus level. In this figure, n = 7–12 for each group. Data are expressed as the mean ± SEM. * p < 0.05, ** p < 0.01, *** p < 0.001 (Kruskal–Wallis test).

