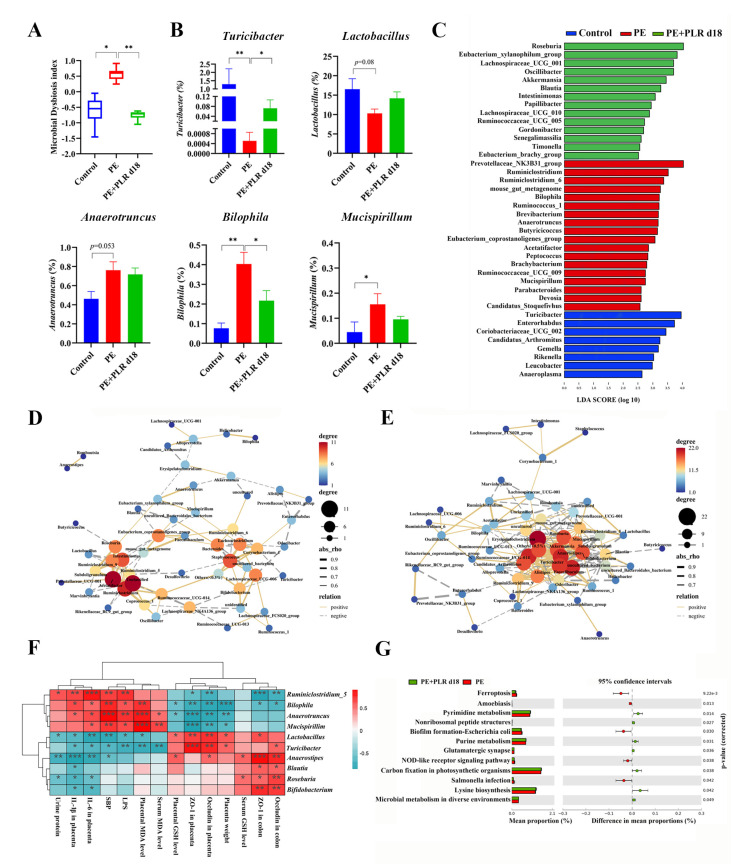
Figure 7.
PLR corrected intestinal dysbacteriosis in PE mice. (A) Microbial Dysbiosis index for each group. (B) Comparison of the gut microbiota of mice among the three groups by Turicibacter, Lactobacillus, Anaerotruncus, Bilophila, and Mucispirillum. (C) Biomarkers at the genus level for each group screened based on LDA score. Different colors represent different groups. (D,E) Correlation network of gut microbiota in the PE and PE+PLR d18 groups. (F) Correlation heatmap of differentially abundant microbial genera and representative indicators. Correlations were determined by calculating Spearman’s correlation coefficient. (G) Pathways that were predicted to show significantly different abundances between the PE group and the PE+PLR d18 group according to the Kyoto Encyclopedia of Genes and Genome (KEGG) pathway analysis. In this figure, n = 7–12 for each group. Data are expressed as the mean ± SEM. * p < 0.05, ** p < 0.01, *** p < 0.001 (Kruskal–Wallis test).

