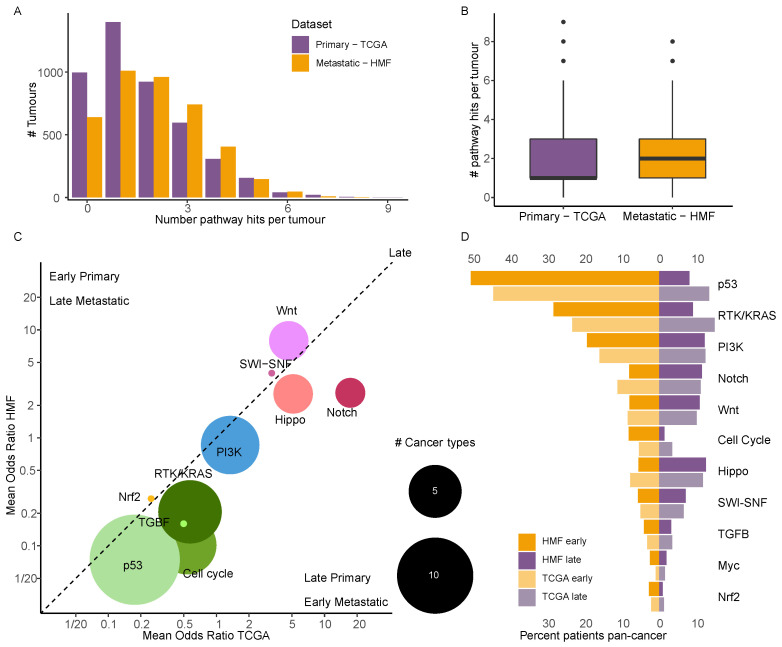
Figure 4.
Enriched timed pathways. (A) Histogram showing the number of affected cancer pathways by driver mutations. (B) Boxplot showing the number of affected specific cancer pathways in primary and metastatic cancer. (C) A bubble plot of the mean odds ratio for enrichment of early or late pathway hits in primary vs. metastatic cancer. The size of the bubble shows the number of significant cancer types. (D) A mirror plot showing the percentage of patients pan-cancer which have been affected by early and late driver mutations in each of the 11 cancer specific pathways.

