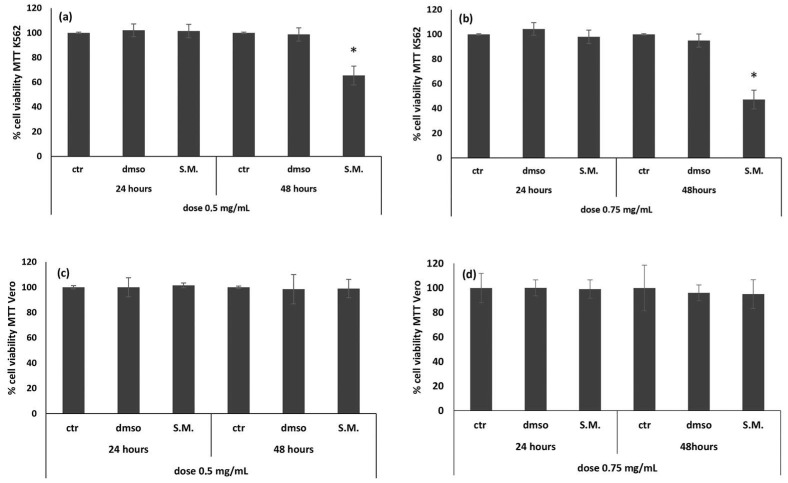
Figure 1.
Effect of Skeletonema marinoi (S.M.) on Vero (c,d) and K562 (a,b) cells viability. MTT test was performed at 24 h and 48 h, using two different concentrations of S.M. (0.5 and 0.75 mg/mL). Data are expressed as a percentage of the cell viability, and results are expressed as the mean ± standard deviation (SD) of three experiments. Statistical differences between control and S.M. were evaluated by one-way analysis of variance (ANOVA), followed by Tukey’s posttest (* p < 0.05 versus ctr/dmso cells).

