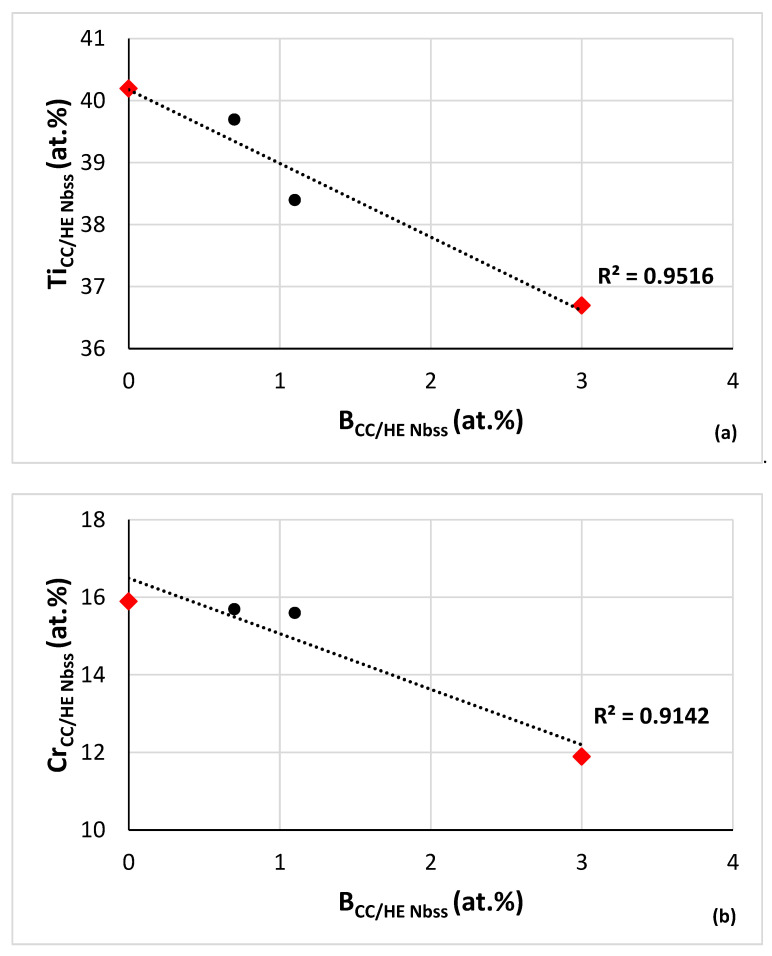
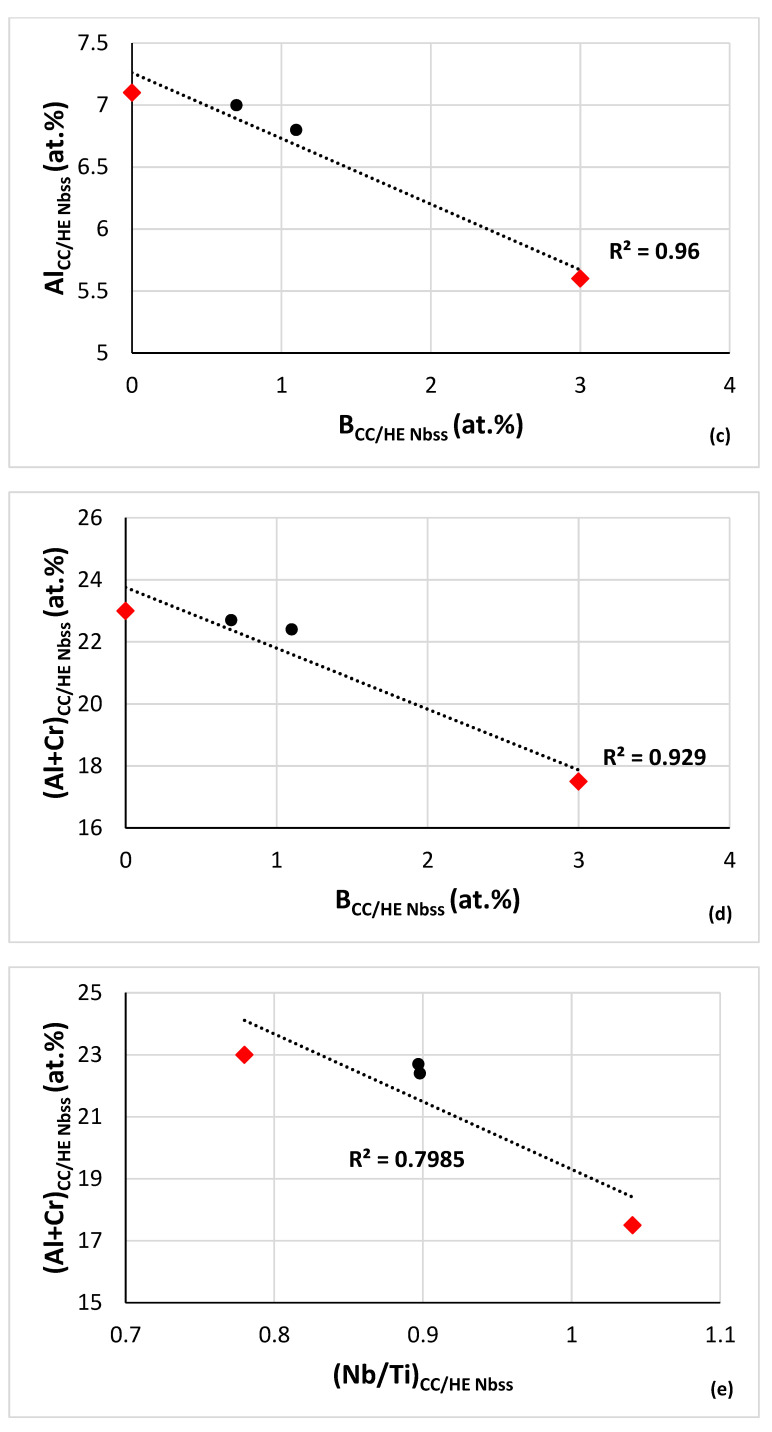
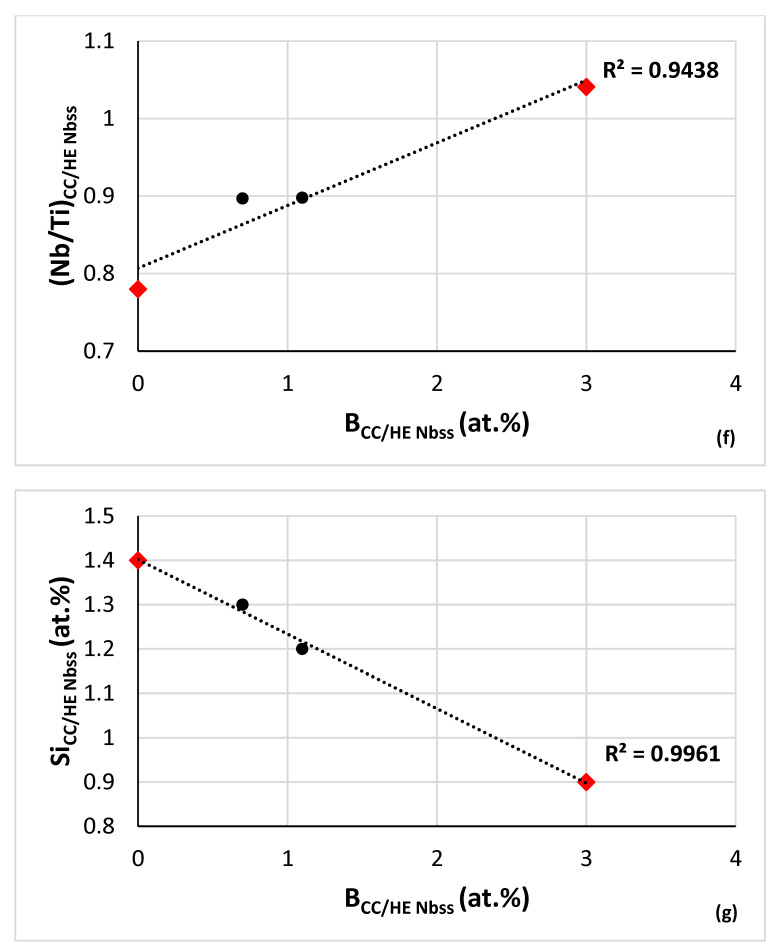
Figure 8.
(a–g) data for the as cast B containing alloys TT4, TT5, TT7, TT8. Diamonds for RM(Nb)ICs/RCCAs. Concentration of B versus (a) Ti, (b) Cr, (c) Al, (d) Al+Cr and (g) Si in CC/HE Nbss. (e) Al+Cr concentration versus Nb/Ti ratio and (f) Nb/Ti ratio versus B concentration in CC/HE Nbss. R2 values are for the linear fit of all data in each part. Parabolic fit of data in (e) gives R2 = 0.9981 with maximum at Nb/Ti = 0.82 and (Al+Cr) = 23.22 at.%. HE Nbss in TT4-AC. For nominal alloy compositions and references see Appendix A.


