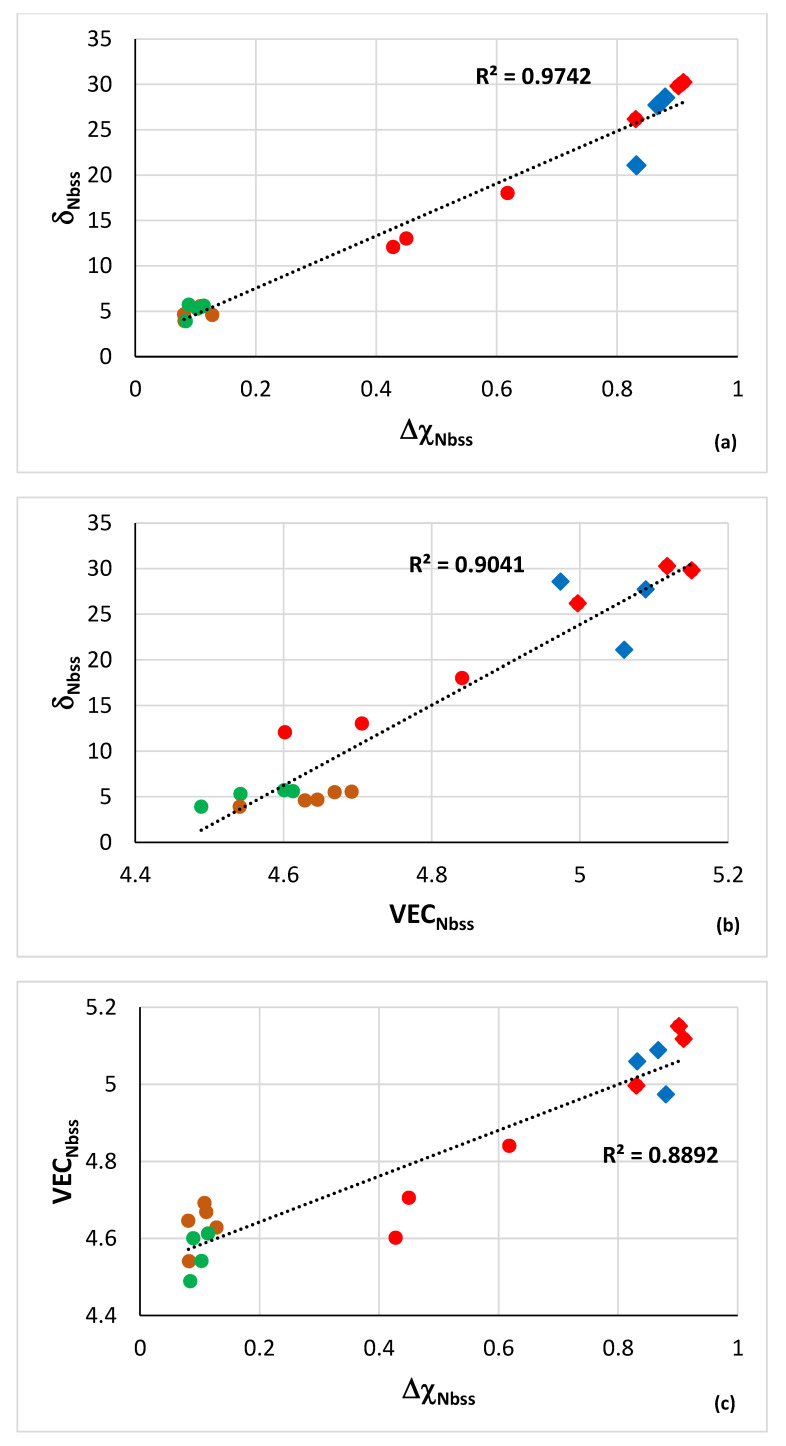
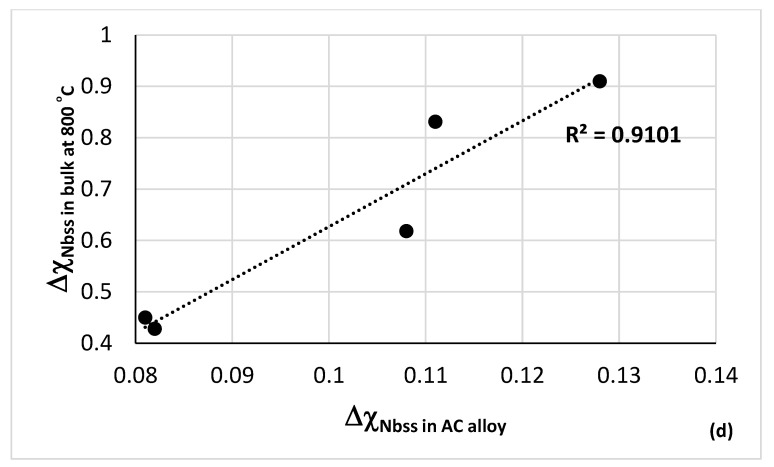
Figure 10.
(a) δNbss versus ΔχNbss (b) δNbss versus VECNbss, (c) VECNbss versus ΔχNbss and (d) Δχ of contaminated Nbss in the bulk of alloy after isothermal oxidation at 800 °C versus Δχ of “uncontaminated” Nbss in AC alloy. (a–c) colours: brown for Nbss in AC alloy, green for Ti rich Nbss in AC alloy, blue for Nbss in diffusion zone (DZ) formed at 800 °C, red for Nbss in bulk of alloy isothermally oxidised at 800 °C. Diamonds for CC/HE Nbss. In each part the R2 value is for the linear fit of all the data. Data for the alloys NV1, NV2, NV5, ZX5 and ZX7. See Appendix A for nominal alloy compositions and references.


