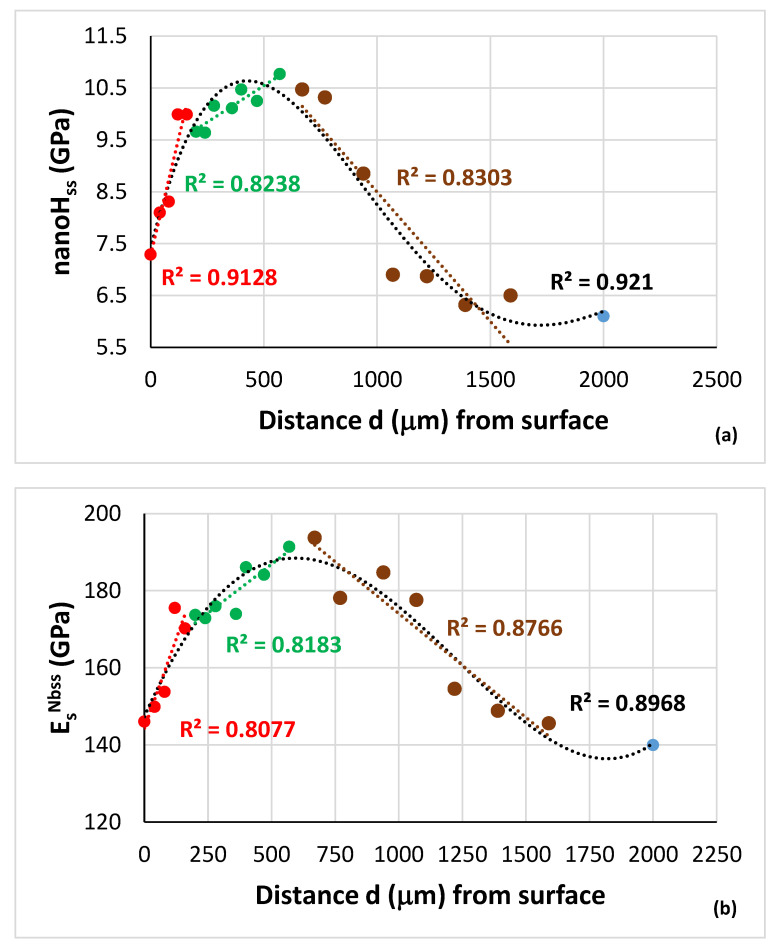
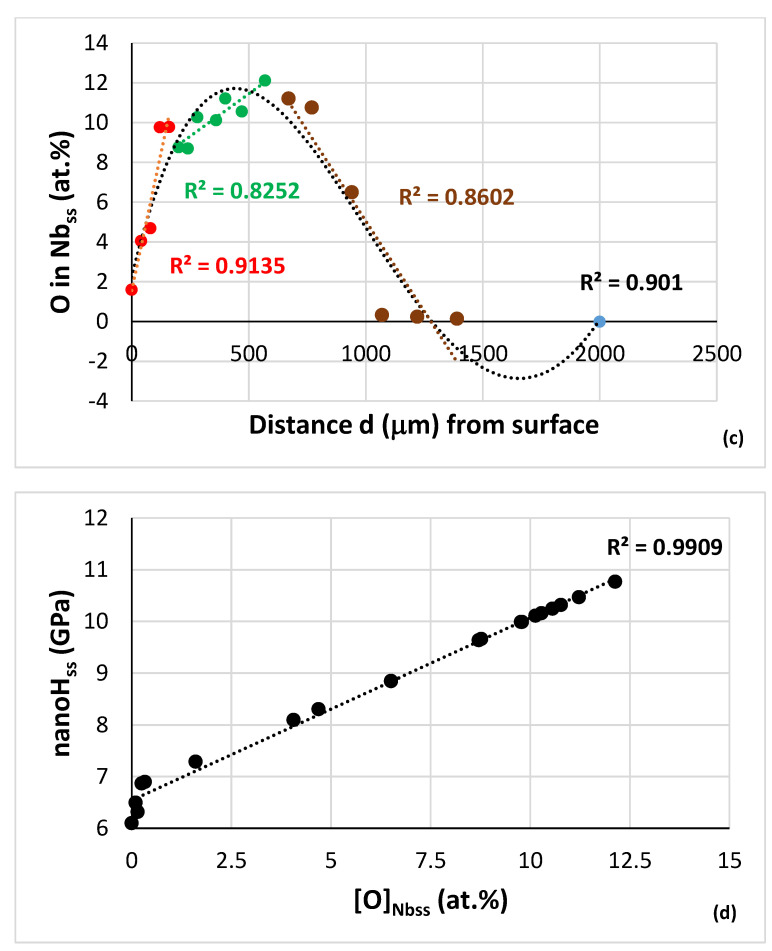
Figure 12.
(a) Average nanohardness, (b) average Young’s modulus and (c) average oxygen concentration of the Nbss in NV1-HT (1500 °C/100 h) as a function of distance from the surface of heat treated specimen. In each part, all the data fit to a 4th order polynomial (see text) with R2 values 0.921, 0.8968 and 0.9016, respectively, for (a–c). (d) Nanohardness of Nbss versus oxygen content.


