Figure 1.
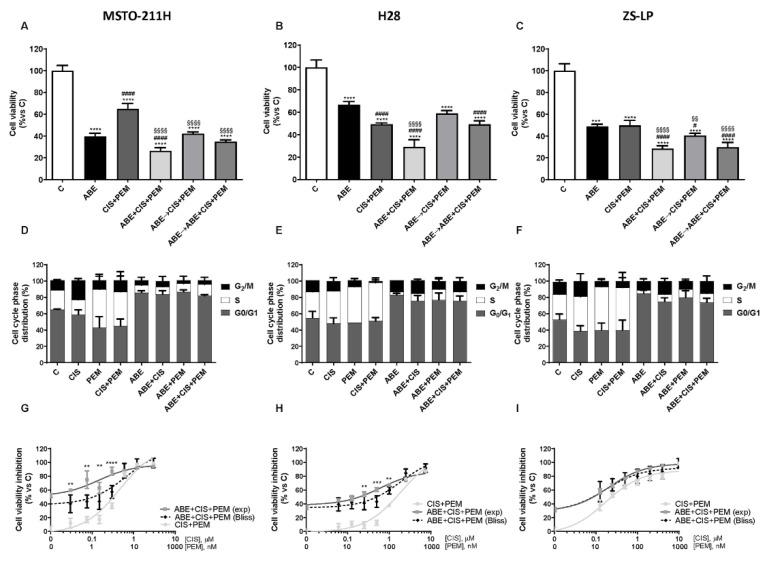
Effects of abemaciclib combined with cisplatin and pemetrexed on cell growth in MPM cell lines. (A) MSTO-211H cells were treated with abemaciclib alone (ABE, 0.5 µM), with the combination of cisplatin (0.3 µM) and pemetrexed (0.02 µM) (CIS + PEM), or with abemaciclib and chemotherapy following different schedules of treatment: simultaneous drug treatment for 72 h (ABE + CIS + PEM), sequential treatment with abemaciclib for 24 h followed by chemotherapy for 48 h (ABE → CIS + PEM), and sequential combined treatment (abemaciclib for 24 h followed by the combined treatment for 48 h, ABE → ABE + CIS + PEM). (B) H28 and (C) ZS-LP cells were exposed to the above-described treatments, using abemaciclib 1 µM, cisplatin 1 µM, and pemetrexed 0.05 µM. Cell viability was assessed by MTT assay and data, expressed as a percentage of cell proliferation versus control, were representative of three independent experiments. Comparison among groups was made by using analysis of variance (one-way ANOVA), followed by Bonferroni’s post-test. **** p < 0.0001 vs. control cells; §§ p < 0.01, §§§§ p < 0.0001 vs. cisplatin + pemetrexed-treated cells; # p < 0.05, #### p < 0.0001 vs. abemaciclib-treated cells. For the evaluation of the cell distribution in the cell cycle phases, (D) MSTO-211H, (E) H28, and (F) ZS-LP cells were treated with abemaciclib, cisplatin, and pemetrexed alone or simultaneously combined. After 24 h MPM cell lines were stained with PI and cell distribution in the cell-cycle phases was evaluated by flow cytometry. Data are expressed as a percentage of distribution in each cell-cycle phase and are the media of three separate experiments. The type of interaction (synergistic, additive, antagonistic) was evaluated through Bliss analysis, as described in Section 2. (G) MSTO-211H, (H) H28, and (I) ZS-LP cells were simultaneously treated with abemaciclib and with increasing concentrations of cisplatin and pemetrexed for 72 h. Then, cell viability was assessed by MTT assay. Data are expressed as percentage of inhibition versus control and are representative of three independent experiments. Student’s t-test ** p < 0.01, *** p < 0.001, **** p < 0.0001.

