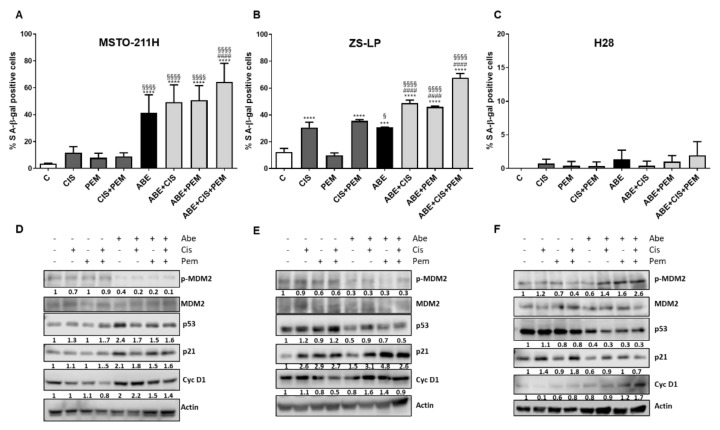
Figure 4.
Effects of abemaciclib in association with cisplatin and pemetrexed on senescence induction in MPM cell lines. (A) MSTO-211H cells were treated with abemaciclib (0.5 µM), cisplatin (0.3 µM), and pemetrexed (0.02 µM), or with the simultaneous combination of abemaciclib and chemotherapy for 72 h. (B) ZS-LP and (C) H28 cells were exposed to the above-described treatments, using abemaciclib 1 µM, cisplatin 1 µM, and pemetrexed 0.05 µM. Data are expressed as a percentage of senescent cells positive for SA-β-Gal expression and are the media of three separate experiments. Comparison among groups was made by using analysis of variance (one-way ANOVA), followed by Bonferroni’s post-test. *** p < 0.001, **** p < 0.0001 vs. control cells; § p < 0.05, §§§§ p < 0.0001 vs. cisplatin + pemetrexed-treated cells; #### p < 0.0001 vs. abemaciclib-treated cells. (D) MSTO-211H, (E) ZS-LP, and (F) H28 cells were treated as described above and Western blotting analysis of proteins involved in cell cycle regulation and senescence induction was performed. The immunoreactive spots were quantified by densitometric analysis; the results are represented by the ratio between phosphorylated and total protein levels or between the total protein and actin levels. The dash (-) represents a non-detectable signal. Data are representative of two independent experiments. Figure S6: Whole Western blots of Figure 4.

