Figure 5.
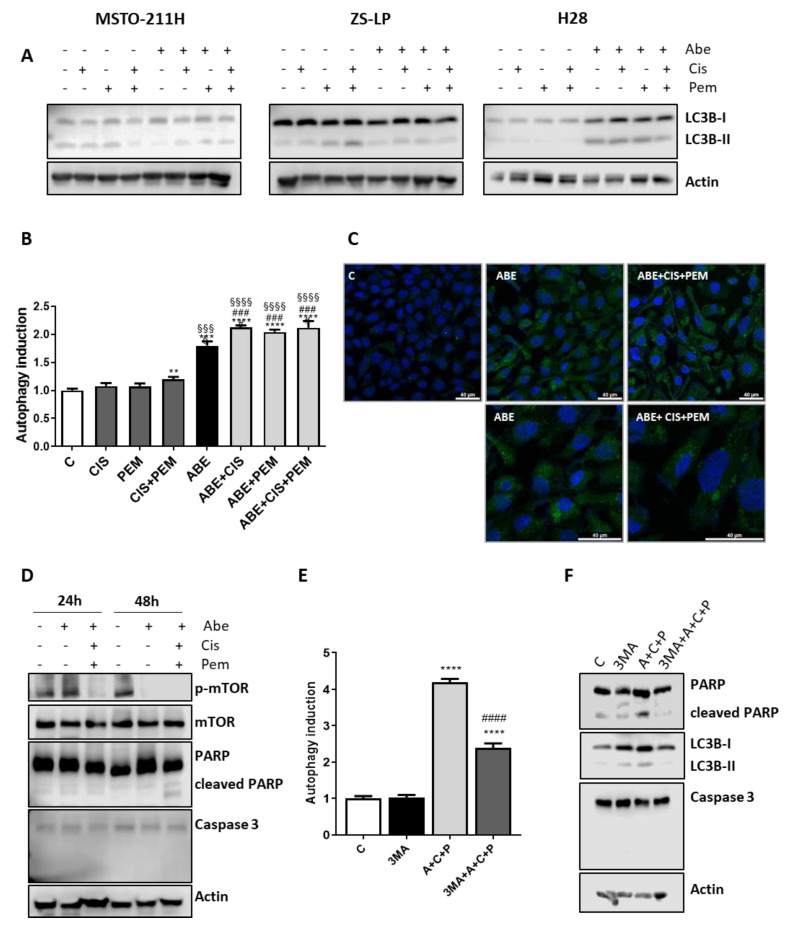
Effects of abemaciclib in association with cisplatin and pemetrexed on autophagy induction in MPM cell lines. (A) MSTO-211H cells were treated with abemaciclib (0.5 µM), cisplatin (0.3 µM), and pemetrexed (0.02 µM), or with the simultaneous combination of abemaciclib and chemotherapy for 72 h. ZS-LP and H28 cells were exposed to the above-described treatments, using abemaciclib 1 µM, cisplatin 1 µM, and pemetrexed 0.05 µM. Western blotting analysis of proteins involved in autophagy induction. Data are representative of two independent experiments. (B) H28 cells were treated as described above, and after 48 h autophagy was assessed by the CYTO-IDR Autophagy detection Kit 2.0. Data are expressed as fold increase versus control (autophagy induction) and are the medians of two separate experiments. Comparison among groups was made by using analysis of variance (one-way ANOVA), followed by Bonferroni’s post-test. ** p < 0.01, *** p < 0.001, **** p < 0.0001 vs. control cells; §§§ p < 0.001, §§§§ p < 0.0001 vs. cisplatin + pemetrexed-treated cells; ### p < 0.001 vs. abemaciclib-treated cells. (C) Representative images by confocal microscopy of H28 cells, treated as described above, stained with CYTO-IDR Autophagy detection Kit 2.0. (D) H28 cells were treated as described above, then cellular proteins were extracted and analyzed by Western blotting using the indicated antibodies. Data are representative of two independent experiments. (E) H28 cells were treated with the simultaneous combination of abemaciclib (1 µM), cisplatin (1 µM), and pemetrexed (0.05 µM), with or without the autophagic inhibitor 3-metyl adenine (2.5 mM). After 48 h, autophagy was assessed by the CYTO-IDR Autophagy detection Kit 2.0. Data are expressed as fold increase versus control (autophagy induction) and are the media of two separate experiments. Comparison among groups was made by using analysis of variance (one-way ANOVA), followed by Bonferroni’s post-test **** p < 0.0001 vs. control cells; #### p < 0.0001 vs. abemaciclib + cisplatin + pemetrexed-treated cells. (F) H28 cells were treated as described in (E), then cells were lysed and cell protein extracts were analyzed by Western blotting for the indicated proteins. Data are representative of two independent experiments. Figure S7: Whole Western blots of Figure 5.

