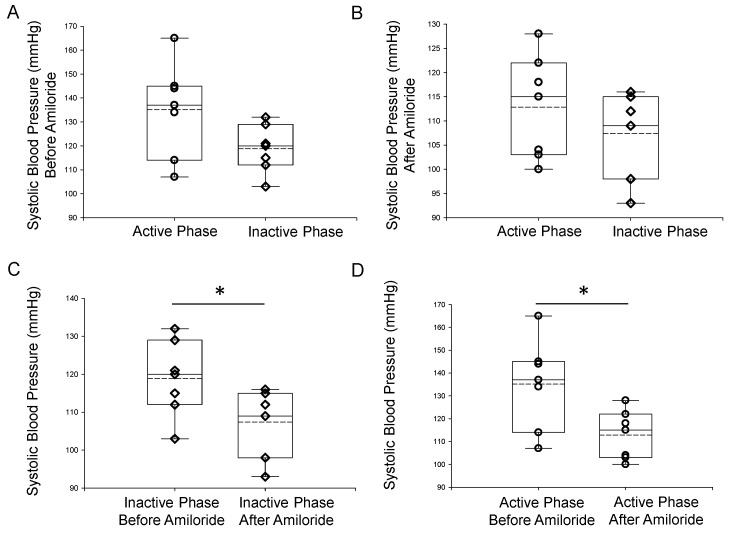
Figure 1.
Tail cuff systolic blood pressure measurements of 18-month-old male mice during the inactive (AM) phase (IP) and active (PM) phase (AP). (A) Summary plot of systolic blood pressure in aged male mice taken during the inactive phase (8 AM) or during the active phase (8 PM). (B) Summary plot of systolic blood pressure in these mice at the same time points but after the mice were injected with benzyl amiloride. (C) Summary plot of systolic blood pressure during the inactive phase (8 AM) before and after the mice were injected with benzyl amiloride. (D) Summary plot of systolic blood pressure during the active phase (8 PM) before and after the mice were injected with benzyl amiloride. A Wilcoxon rank sum test was performed to compare the two groups. n = 7 mice in each group. The open circles represent individual data points from the AP group and the open triangles represent individual data points from the IP group. * Represents a p-value of ≤0.05.

