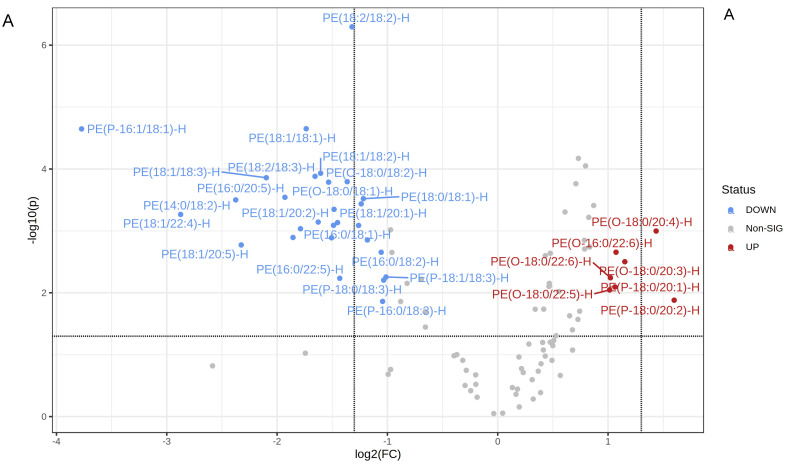
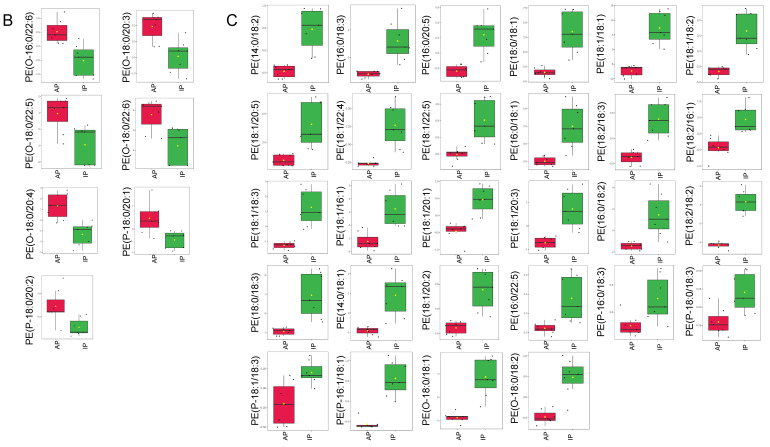
Figure 4.
Phosphatidylethanolamine levels in uEVs isolated from urine collected during the inactive and active phases of spontaneously hypertensive aged male mice. (A) Volcano plot showing all PE’s increased or decreased in the EVs from the active phase (AP) group compared to the inactive phase (IP) group and all other PE’s that did not show a statistically significant difference between the two groups. The fold change threshold was set to 2.0 and the p-value threshold was set to 0.05. Data were normalized to the median with Pareto scaling and the plots were made in MetaboAnalyst software. (B) Normalized plots showing 7 PE’s that are significantly increased in EVs isolated from urine samples collected during the AP compared to the IP. (C) Normalized plots showing 28 PE’s that are significantly decreased in EVs from the AP group compared to the IP group. n = 7 samples per group. EVs isolated from AP urine are in red and EVs isolated from IP urine are in green. The concentration of each lipid on the y-axis is given in μM.


