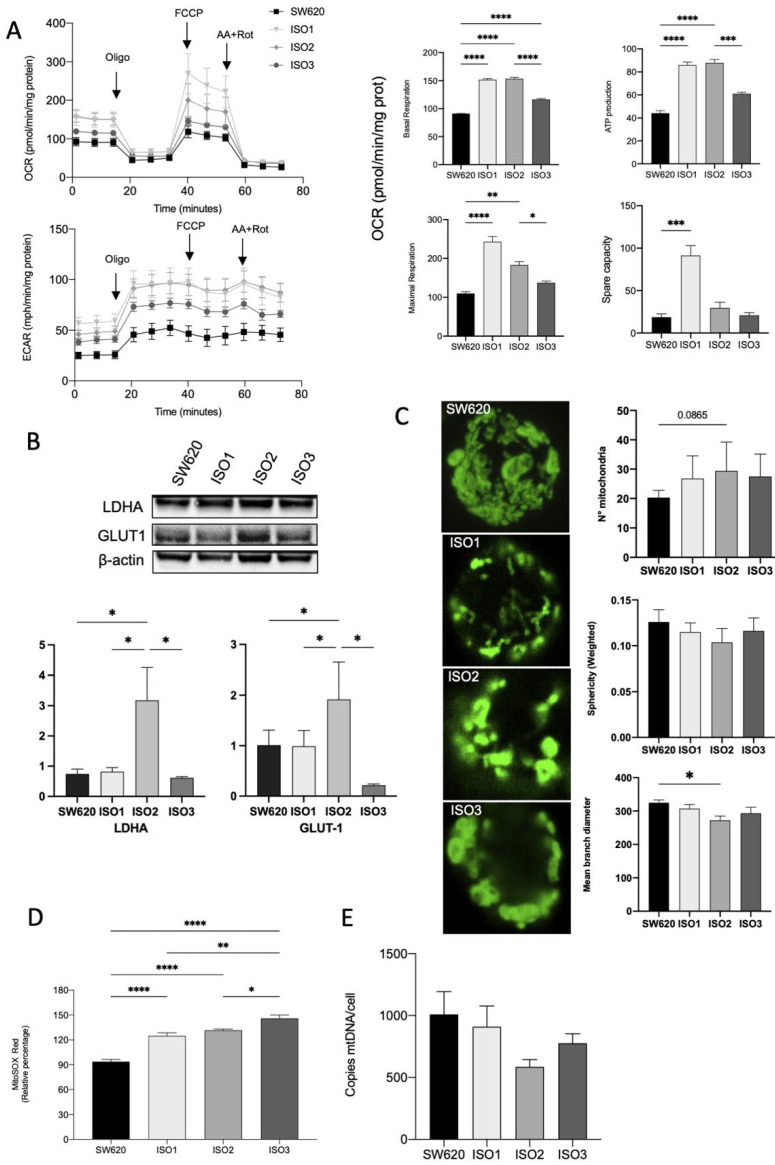
Figure 3.
Effects of Lonp1 isoform-1, isoform-2, and isoform-3 overexpression on mitochondrial functions. (A). Seahorse analysis of oxygen consumption rate (OCR) and extracellular acidification rate (ECAR) in SW620 and cells overexpressing Lonp1-ISO1, Lonp1-ISO2, or Lonp1-ISO3 (on the left). Histograms showing single parameters of OCR, basal respiration, ATP production, maximal respiration, and spare capacity in the same cell lines (on the right). Data are reported as mean ± SD of three independent experiments. (B). Representative immunoblots showing LDHA and GLUT1 expression in SW620 and cells overexpressing Lonp1 isoform-1, isoform-2, and isoform-3 (upper panel). Histograms showing the relative expression of LDHA and GLUT1 in the same cell lines (lower panel). Data are reported as mean ± SD of three independent experiments. (C). Representative confocal microscopy images of mitochondria in SW620 and cells overexpressing Lonp1-ISO1, Lonp1-ISO2, or Lonp1-ISO3 (on the left). Mitochondria were stained with anti-hMit. Histograms showing the analysis of total number of mitochondria, sphericity, and mean branch diameter in SW620 and cells overexpressing Lonp1-ISO1, Lonp1-ISO2, or Lonp1-ISO3 calculated by FIJI (ImageJ) (on the right). Data are reported as mean ± SD of ten independent experiments. (D). Histogram showing ROS relative percentage in SW620 and overexpressing Lonp1-ISO1, Lonp1-ISO2, or Lonp1-ISO3. Data are reported as mean ± SD of three independent experiments. (E) Histogram showing the number of copies of mtDNA per cell is SW620 cells overexpressing Lonp1-ISO1, Lonp1-ISO2, or Lonp1-ISO3. Data are reported as mean ± SD of three independent experiments. * = p < 0.05; ** = p < 0.01; *** = p < 0.001; **** = p < 0.00001.

