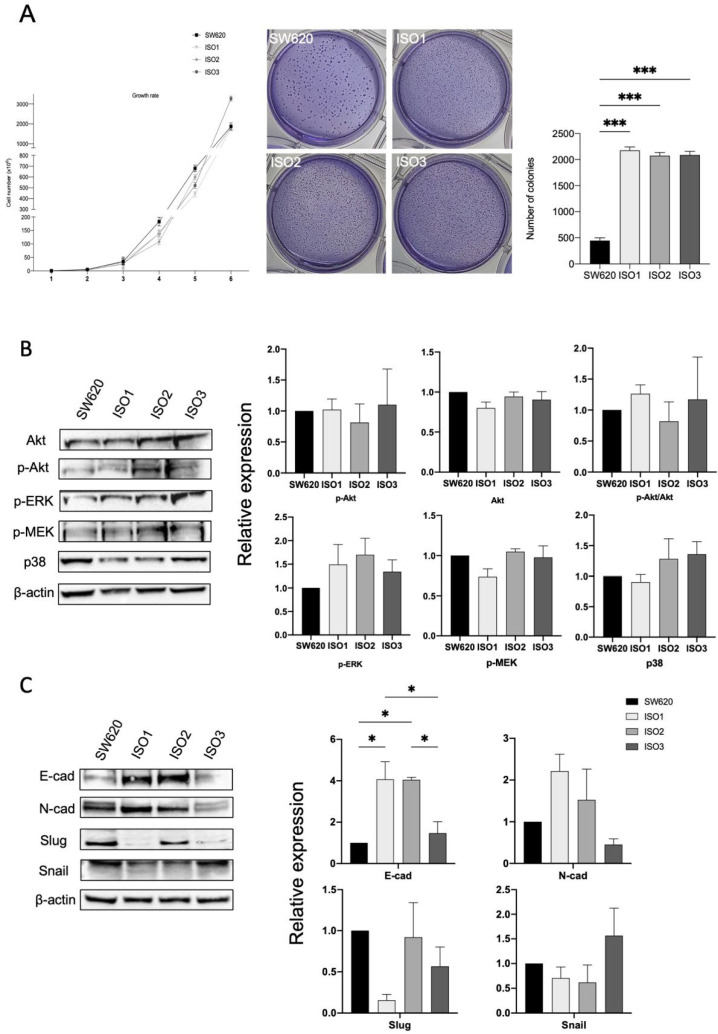
Figure 4.
Lonp1 isoforms can affect cancer development and progression. (A). Graph showing the growth rate of SW620 and cells overexpressing Lonp1 isoform-1, isoform-2, and isoform-3 (on the left). Soft agar colony formation assay of SW620 and cells overexpressing Lonp1 isoform-1, isoform-2, and isoform-3 (in the middle). Histogram showing the number of colonies, from soft agar colony formation assay, of SW620 and cells overexpressing Lonp1 isoform-1, isoform-2, and isoform-3 (on the right). Data are reported as mean ± SD of two independent experiments. (B). Representative immunoblots showing Akt, P-Akt, P-ERK, P-MEK, and p38 expression in SW620 and cells overexpressing Lonp1 isoform-1, isoform-2, and isoform-3 (on the left). Histograms showing the relative expression of Akt, P-Akt, P-Akt/Akt, P-ERK, P-MEK, and p38 in the same cell lines (on the right). Data are reported as mean ± SD of three independent experiments. (C). Representative immunoblots showing E-cad, N-cad, Slug, and Snail expression in SW620 and cells overexpressing Lonp1 isoform-1, isoform-2, and isoform-3 (on the left). Histograms showing the relative expression of E-cad, N-cad, Slug, and Snail in the same cell lines (on the right). Data are reported as mean ± SD of three independent experiments. * = p < 0.05; *** = p < 0.0001.

