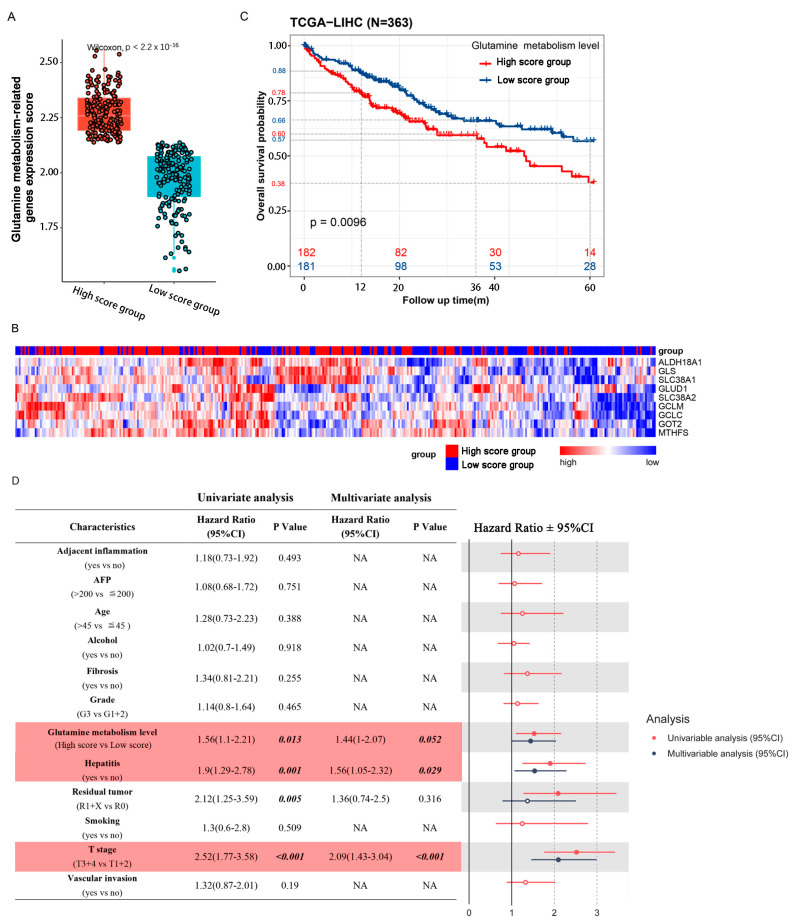
Figure 1.
Glutamine metabolic activity of tumor tissue is associated with patient prognosis. (A) 363 patients of a TCGA cohort could be divided into 2 groups according to the median value of glutamine-metabolism-related gene expression scores. (B) Expression levels of individual genes (ALDH18A1, GCLC, GCLM, GLS, GLUD1, GOT2, MTHFS, SLC38A1 and SLC38A2) are displayed as a heatmap, with low expressions in blue and high expressions in red. The left side of the heatmap shows patients with high scores and the right side shows patients with low scores. (C) Kaplan–Meier analysis shows that patients with high scores suffered a worse overall survival rate. Numbers of patients and risk classifications are indicated in the figure. Significance was calculated using the log-rank test. (D) CPHR analysis results of glutamine-metabolism-related gene expression scores and clinical factors. The forest on the right shows the results of the univariate and multivariate analyses, with reference value of the hazard ratio = 1. Line intersection with reference line suggests no statistical difference. Red represents univariate analysis, and blue represents multivariate analysis.

