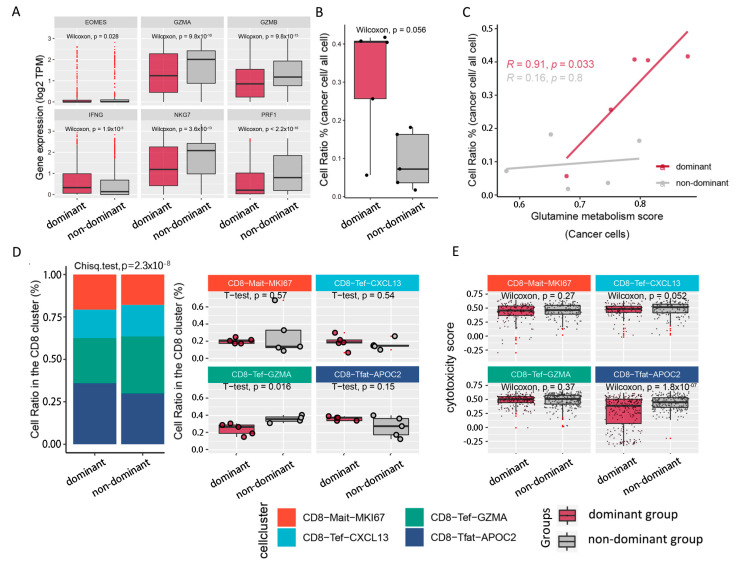
Figure 3.
Differences in composition ratios and antitumor abilities in CD8T subpopulations. (A) Box plot showing the expressions of cytotoxicity-related genes (GZMA, GZMB, PRF1, IFNG, EOMES and NKG7). (B) Box plot illustrating cancer cell ratios in the TME of different populations. (C) Fitting curve presenting the correlation between glutamine-metabolism-related gene expression scores and cell ratios of cancer cells; correlation coefficients and significance tests are annotated in the figure. Gray indicates nondominant group, and light purple indicates dominant group in (A–C). (D) Stacked bar plot on the left shows the cell ratios of CD8T cell subtypes in the TME of dominant group vs. nondominant group. Box plot on the right compares the cells ratios of CD8T cell subtypes between the 2 populations. (E) Box plot representing the difference in cytotoxicity scores in CD8T cell subtypes between 2 populations. Metadata of CD8T cells in the TME of 10 primary hepatocellular carcinoma patients are listed in Supplementary Table S5.

