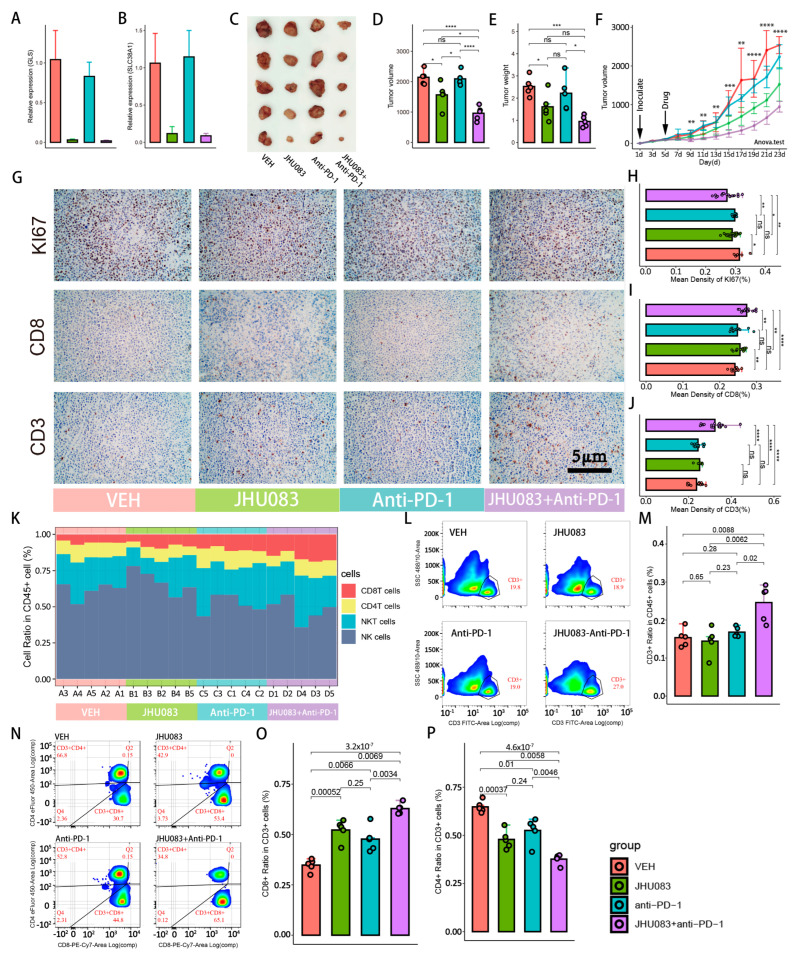
Figure 6.
Glutamine metabolism inhibitors promote the proliferation of CD8+ T cells and improve response to immunotherapy. Groups are labeled with different colors: red, green, blue, and purple indicate VEH, JHU083, antiPD-1, and JHU083 + antiPD-1 groups, respectively. ns: no significance; * p < 0.05; ** p < 0.01; *** p < 0.001; **** p < 0.0001. (A,B) RNA relative expressions of GLS. The sequence of primer is listed in Supplementary Table S12. (A) and SLC38A1 (B) in tumor tissue after treatment with drugs. (C) Mouse subcutaneous tumors after inoculation with H22 cell for 22 days. (D,E) Box plots showing volumes (D) and weights (E) of tumor tissues of 4 groups after harvesting. The raw data on tumor volumes and weights are given in Supplementary Table S10. (F) Tumor growth curve illustrating the tumor growth rates of different groups. Inoculation with H22 cells occurred on the first day, and drug treatment occurred on the third day. Tumor volumes were measured every 2 days. Significance test was performed with ANOVA. Raw data on tumor volumes are given in Supplementary Table S11. (G) Immunofluorescence of Ki67, CD8, and CD3. Brown was considered to be strongly positive staining. (H–J) Box plots indicating immunohistochemical quantification of Ki67, CD8 and CD3. (K) Stacked bar plot showing dynamic changes in 4 immune cells sorted by the proportion of CD8+ T cells from small to large. Mouse numbers are marked on the x-axis. (L,N) Cell-sorting diagrams of flow cytometry, including T cells (L), CD8+ T cells, and CD4+ T cells (N). Antibodies used in flow cytometry are given in Supplementary Table S13. (M,O,P) Histograms showing changes in above cell ratios of 4 groups.

