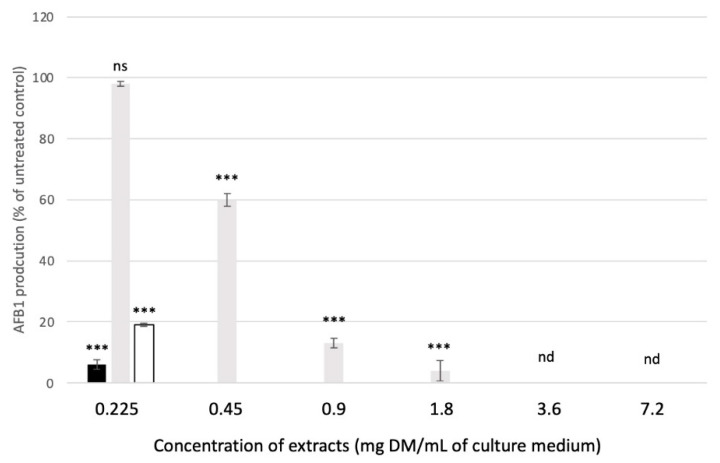
Figure 5.
AFB1 production when exposed to various concentrations of mate (black bars), rosemary (grey bars) and green tea (white bars) extracts. ns: not significant. nd: not detected for the three extracts. Results correspond to the mean +/− SD of three distinct experiments and are expressed as percentages of the AFB1 produced by untreated A. flavus control cultures. Significant differences between concentrations of the same plant extract are indicated with *** for p-value < 0.001.

