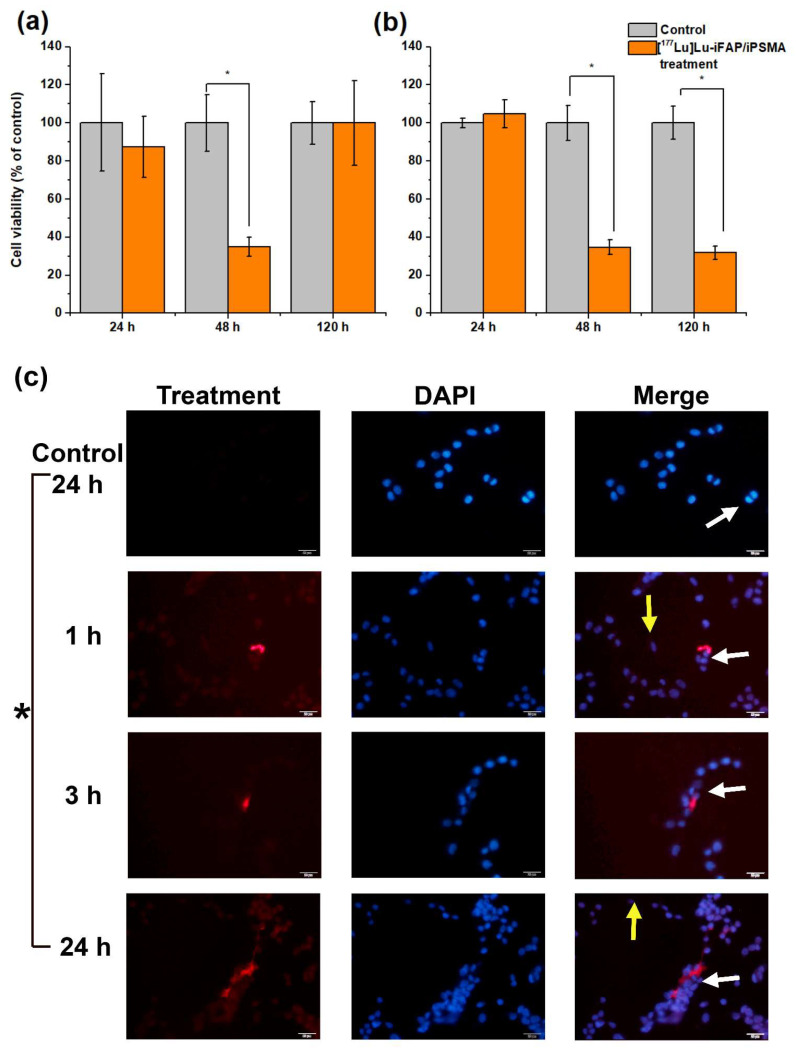
Figure 2.
Cell viability of (a) U-937 macrophages and (b) HCT116 colorectal cancer cells exposed to [177Lu]Lu−iFAP/iPSMA nanoparticles for 24, 48, and 120 h (orange bar). Untreated cells were considered the control group (gray bar). (c) Representative fluorescence micrographs (400×) of a coculture of colorectal cancer cells and macrophage immune cells. The coculture was treated with [177Lu]Lu−iFAP/iPSMA nanoparticles for 1, 3, and 24 h. Control: cells without treatment at 24 h (red optical density of 10.95 ± 2.23). Red: emission of nanoparticles with an optical density of 29.57 ± 5.35, 34.17 ± 1.76, 79.85 ± 1.07 at 1, 3, and 24 h, respectively; Blue: DAPI (cell nuclei) and merged images. Yellow arrows point to colorectal cancer cells (tendency toward an oval shape). White arrows indicate macrophages (more prominent and more rounded than cancer cells). Of note is the significant presence of nanoparticle clusters associated with the cytoplasm of macrophages, whose accumulation increases markedly over time in parallel with macrophage proliferation. * Statistically significant difference (p < 0.05).

