Figure 5.
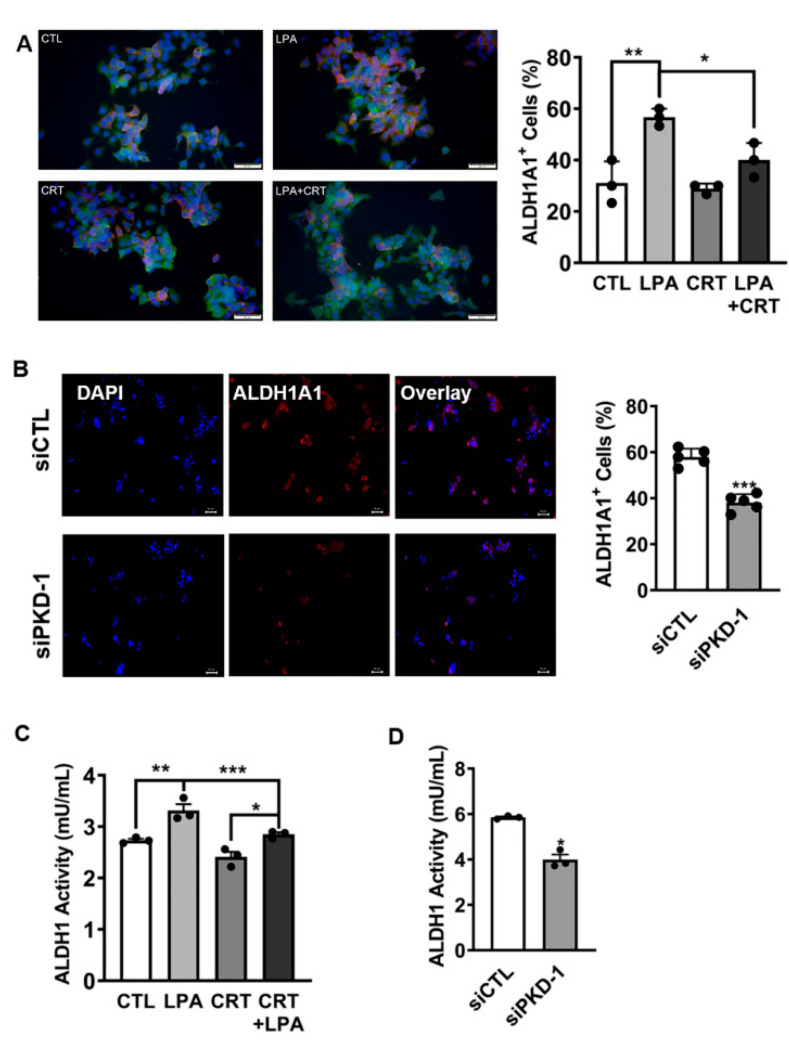
Association of PKD1 signaling with ALDH1. (A) BON cells were cultured in DMEM/F12 medium with 5% FBS. After starvation in serum-free DMEM/F12 medium for 6 h, the cells were treated with 10 µM of LPA, and/or 5 µM of CRT in serum free DMEM/F12 medium for an additional 24 h under 5% CO2 at 37 °C. The cells were incubated with ALDH1A1 and PKD1 antibodies, followed by appropriate secondary antibodies. The percentages of cells with high levels of ALDH1A1 expression (red) were calculated by randomly counting up to 30 individual cells, and triple counting was performed. GraphPad Prism 9 was used for statistical analysis. (B) BON cells were transfected with scramble control or PKD1 siRNA for 24 h, and the cells were processed for staining with an ALDH1A1 antibody, followed by an appropriate secondary antibody. The ratio of cells with high levels of ALDH1A1 expression were calculated under a fluorescence microscope by counting up to 100 cells randomly in each field. Five repetitions were performed. Statistic difference was evaluated by GraphPad Prism 9. (C) BON cells were treated with 10 µM LPA, 2 µM CRT0066101, or their combination for 24 h. ALDH1 activity was measured by ELISA in a plate reader. (D) BON cells were transfected with scramble control or PKD1 siRNA to knock down endogenous expression. ALDH1 activities were measured by ELISA in a plate reader. Triplicate experiments were performed. The results were shown as the mean ± SEM. * p < 0.05, ** p < 0.01, and *** p < 0.001.

