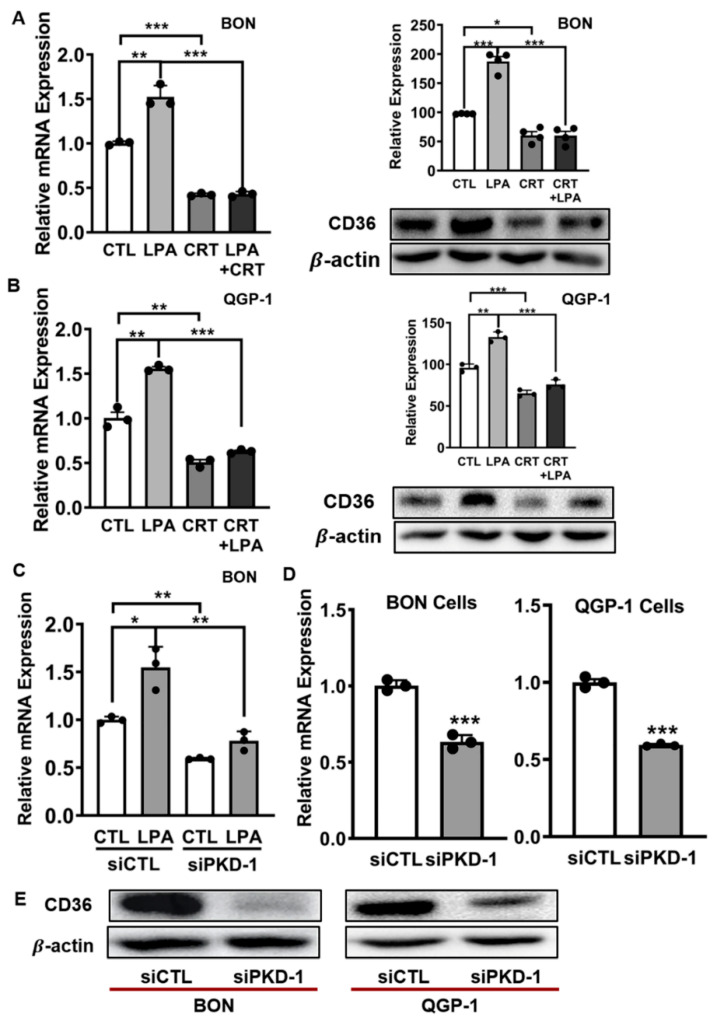
Figure 6.
Regulation of CD36 expression by PKD1 signaling in pNET cells. (A) BON cells were exposed to 10 µM LPA, 2 µM CRT0066101, or their combination, for 24 h. Total RNA was isolated for CD36 gene expression by RT-qPCR (left panel), and cell lysates were collected and subjected to Western blot for CD36 protein expression (right panel). (B) QGP-1 cells were treated and assayed for CD36 gene and protein expression as (A). (C) BON cells were transfected with scramble control or PKD1 siRNA for 24 h, followed by treatment with 10 µM LPA for an additional 24 h. Total RNA was isolated for CD36 gene expression by RT-qPCR. (D) The pNET cells were transfected with scramble control or PKD1 siRNA to knock down endogenous PKD1 gene expression, and total RNA was isolated for CD36 gene expression by RT-qPCR. (E) The pNET cells were transfected with scramble control or PKD1 siRNA to knock down endogenous PKD1 gene expression, and cell lysates were collected and subjected to Western blotting for CD36 protein levels. Shown are representative images. CD36 protein levels were assessed by densitometry with NIH Image J. Triplicate experiments were performed. * p < 0.05, ** p < 0.01, and *** p < 0.001.

