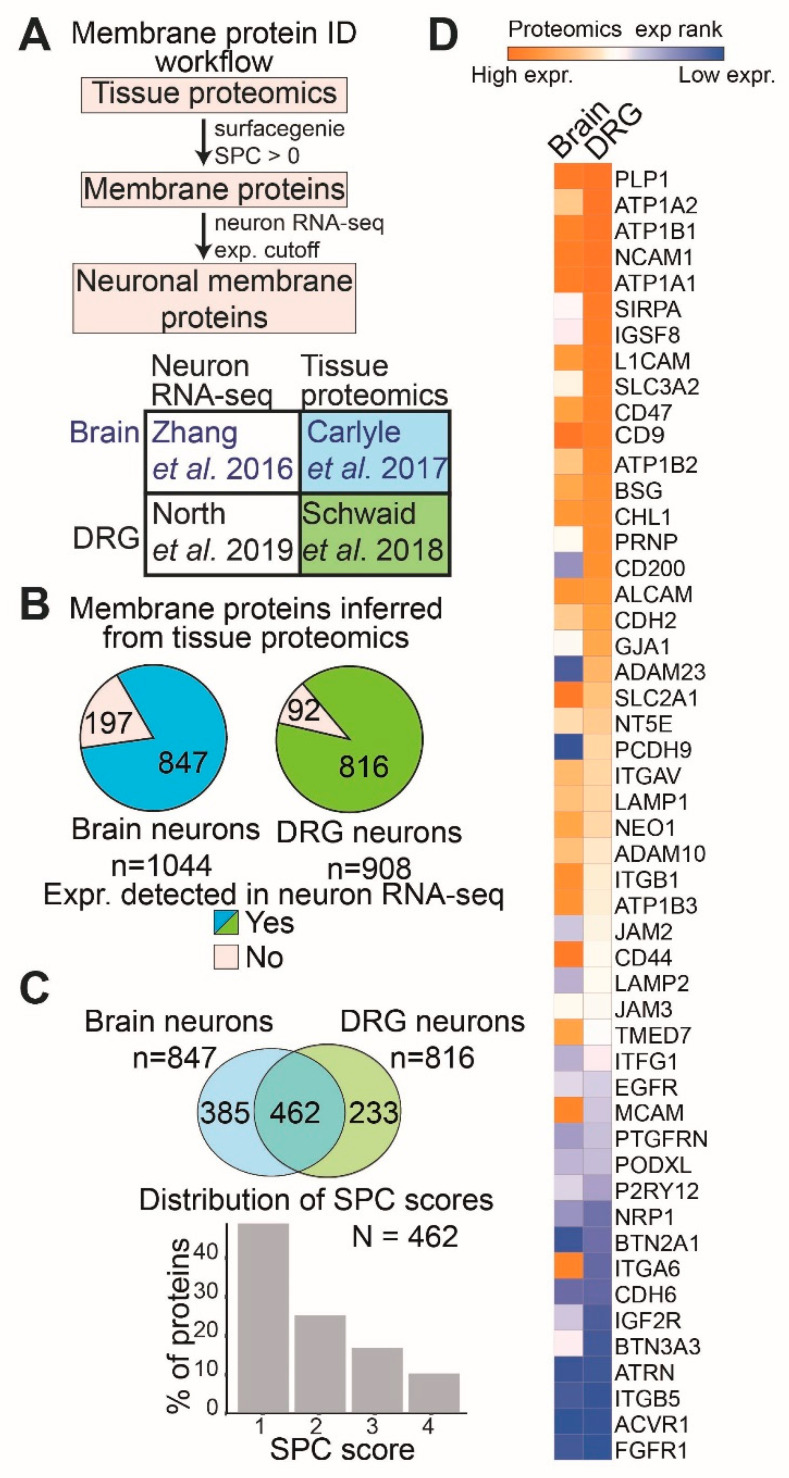
Figure 1.
Analysis of human tissue proteomics and neural RNA sequencing data reveals several membrane proteins expressed in both brain and DRG neurons. (A) Pipeline for analysis (top) and the datasets used for brain [14,17] and DRG [15,16] neuron inferred membrane proteome analysis (bottom). (B) Pie charts representing all the membrane proteins (SurfaceGenie SPC score ≥ 1) identified from the human brain and DRG tissue proteomics. The pie section in green (brain), and blue (DRG) represents a protein with a more than median gene expression (expr.) in brain- or DRG-specific neuronal RNA sequencing. (C) Venn diagram comparing the inferred brain and DRG neuronal membrane proteome (top). Bar plot showing the distribution of SurfaceGenie SPC scores for the proteins common to both brain and DRG neuronal membrane proteome. (D) Heatmap of the brain and DRG tissue proteomics ranked expression (expr.) of high-confidence (SPC score ≥ 3) surface proteins common to both brain and DRG neuronal membrane proteome. All proteins and their ranks are listed in Table S1.

