Figure 2.
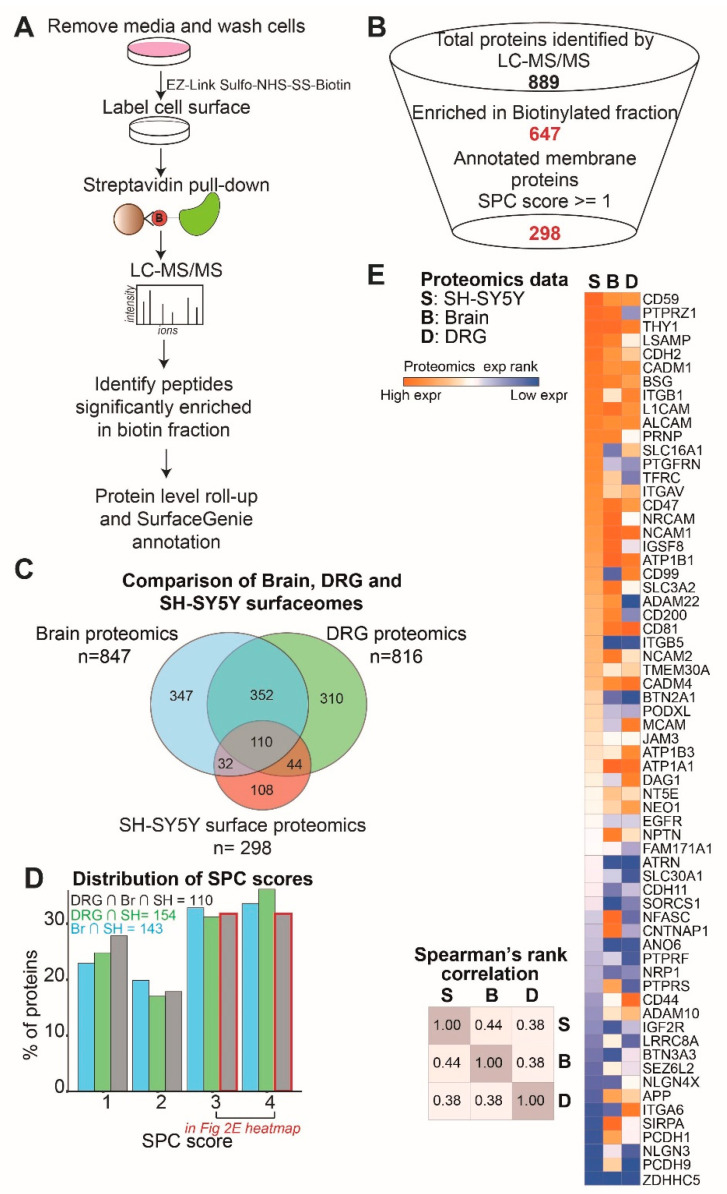
Surface proteomics identifies nearly 300 SH-SY5Y membrane-associated proteins. (A) An experimental workflow for cell surface labeling followed by proteomics. (B) Bioinformatic selection funnel used to identify biotin-labeled proteins and select for high-confidence surface proteins. Proteins enriched in biotin compared to control fractions listed in Table S2. (C) Venn diagram showing the overlap between membrane proteins identified in brain and DRG neurons as well as SH-SY5Y cells. The overlap of each pairwise comparison shown here is statistically significant, as calculated by the hypergeometric test (p-values < 2.2 × 10⁻¹⁶). All proteins common to all three classes and their expression ranks are listed in Table S3. (D) Distribution of SPC scores for pairwise comparisons including SH-SY5Y cells shown in (C) and for proteins present in all three classes. (E) Heatmap of the brain and DRG proteomics as well as SH-SY5Y surface proteomics ranked expression of high-confidence (SPC score ≥ 3) surface proteins common to all 3 datasets (left). Heatmap of Spearman’s rank correlation for pairwise comparisons of protein expression in the three datasets.

