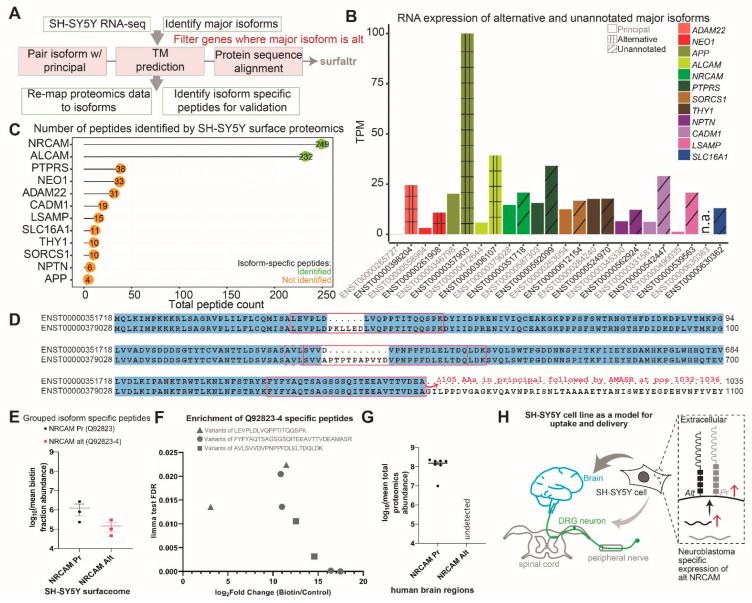
Figure 3.
Alternatively spliced major isoforms expressed on the surface of SH-SY5Y cells. (A) Schematic describing the bioinformatics pipeline for identification of surface protein isoforms expressed on SH-SY5Y cells by using both proteomics and transcriptomics data. Grey boxes describe all the analyses included in the surfaltr R package (details in the methods section). (B) Barplot showing RNA expression of alternatively spliced and APPRIS-unannotated major isoforms for surface protein-coding isoforms expressed in SH-SY5Ycells and common to the brain and DRG tissues. Isoform quantification for all transcripts listed in Table S4. Alternative, principal, and unannotated isoforms are shaded as indicated in the legend. (C) Total number of peptides identified via surface proteomics for alternatively spliced and APPRIS-unannotated major isoforms described in (C). (D) Protein sequence alignment of NRCAM alternatively spliced (NRCAM alt, ENST00000351718) SH-SY5Y specific major isoform to NRCAM APPRIS-annotated principal isoform (NRCAM Pr, ENST00000379028). Regions where the two isoforms differ in sequence have been highlighted by the red box. The red arrow followed by text indicate sequence of the NRCAM alt isoform (ENST00000351718) not shown in the alignment and represented by the peptide indicated by a circle in (F). (E) Plot showing log10(mean abundance) of NRCAM isoform-specific peptides in the three biotin fraction replicates. Both isoforms are detected at comparable levels in the SH-SY5Y surfaceome dataset. (F) Scatterplot showing the enrichment of NRCAM Q92823-4 isoform-specific peptides in SH-SY5Y surface biotinylated fraction compared to control (X-axis) and the statistical significance of this enrichment in three biological replicates, as determined by the limma test FDR (Y-axis). (G) Boxplot showing the median abundance of NRCAM isoform-specific peptides in the human brain, as detected by Carlyle et al. [14] using proteomics. Abundance is indicated as mean log10 transformed intensity for all peptides mapping to the NRCAM isoform. Peptides specific to the alternative NRCAM (Q92823-4) were not detected in any brain region (dots represent the eight brain regions tested—dorsolateral prefrontal cortex, primary visual cortex, hippocampus, amygdala, mediodorsal nucleus of the thalamus, striatum, and cerebellar cortex). (H) Model summarizing the results of this study, which shows that the SH-SY5Y surfaceome is representative of both brain and DRG neuron surfaceomes, but expression levels are more similar to the brain (indicated by dark and light grey arrows). Furthermore, SH-SY5Y cells express a neuroblastoma-specific alternatively spliced NRCAM isoform (Q92823-4) which shows discordant expression by being the major isoform at the RNA level but the minor isoform at the protein level, as indicated by the red arrows.

