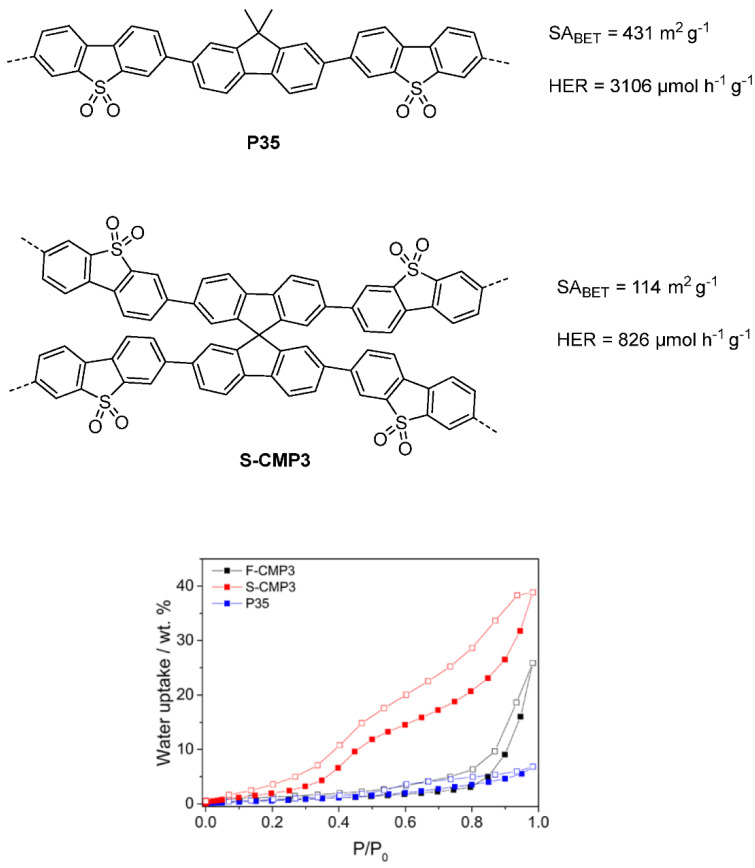
Figure 28.
Top: Linear and microporous conjugated polymers with their corresponding BET surface areas and hydrogen evolution rates. Bottom: Water uptake measurements performed at 20 °C for S-CMP3, F-CMP3, and P35, respectively. Solid squares indicate adsorption whilst open squares indicate desorption [Figure from ref. [37] under CC-BY License].

