Figure 1.
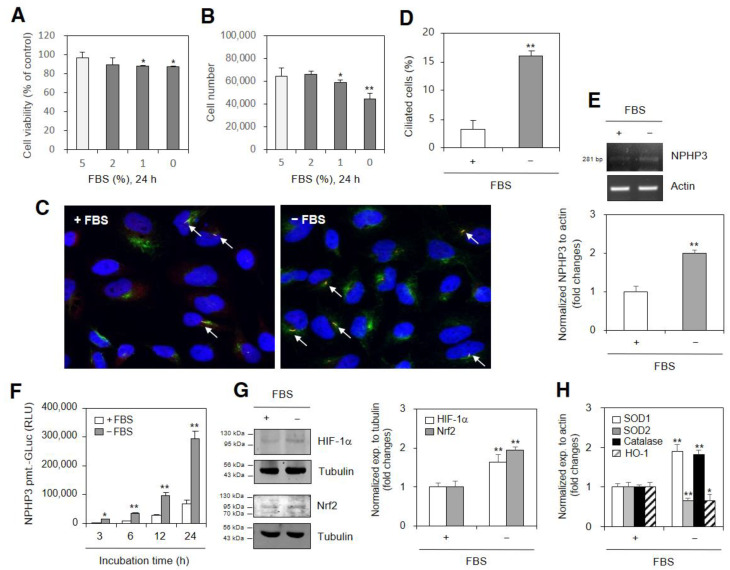
Changes in cell viability and cell number were associated with primary cilium formation, NPHP3 expression and HIF-1α stabilization under serum-deprived (SD) condition. (A–E) HeLa cells were incubated in a medium with various percentages of fetal bovine serum (FBS) for 24 h. Cell viability was measured by the trypan exclusion assay (A). Cell number was counted by using hemocytometer (B). The cells were fixed and stained with antibodies against Ac-tubulin (green) and Arl13b (red). Nucleus was stained with DAPI (blue). The primary cilium was observed with 1000× magnification under fluorescence microscope. The image with primary cilia is the representative out of ≈30 pictures. White arrows indicated primary cilia (C). The ciliated HeLa cells (n > 500 cells) in the presence (white) or absence (grey) of FBS were counted (D). Total RNA was prepared by using NucleoZOL® and the expression level of NPHP3 was measured by RT-PCR (E top). Density of each band was analyzed by ImageJ 1.34 n and results were normalized to actin (E bottom). (F) HeLa cells were transfected with pEZX-PG02-NPHP3-promoter Gaussia luciferase (Gluc) plasmids and incubated in the presence or the absence of FBS for up to 24 h. The activity of Gluc in cultured media was measured with luminometer using Gluc substrate. (G–H) HeLa cells were incubated with or without FBS for 24 h. Cell lysates were prepared. HIF-1α and Nrf2 proteins were detected by Western blot analysis (left). Density of each band was analyzed by ImageJ 1.34 n and results were normalized to tubulin (right). Total RNA was prepared by using NucleoZOL® and the expression level of each antioxidant gene was measured by Q-PCR (H). Data were the representative of four experiments. Processing (such as changing brightness and contrast) is applied equally to controls across the entire image (C,E,G). Data in bar graphs represents the means ± SEM. * p < 0.05, ** p < 0.01; significantly different from 5% FBS-treated control group (A,B,D, E bottom, G right, H) at each time point (F).

