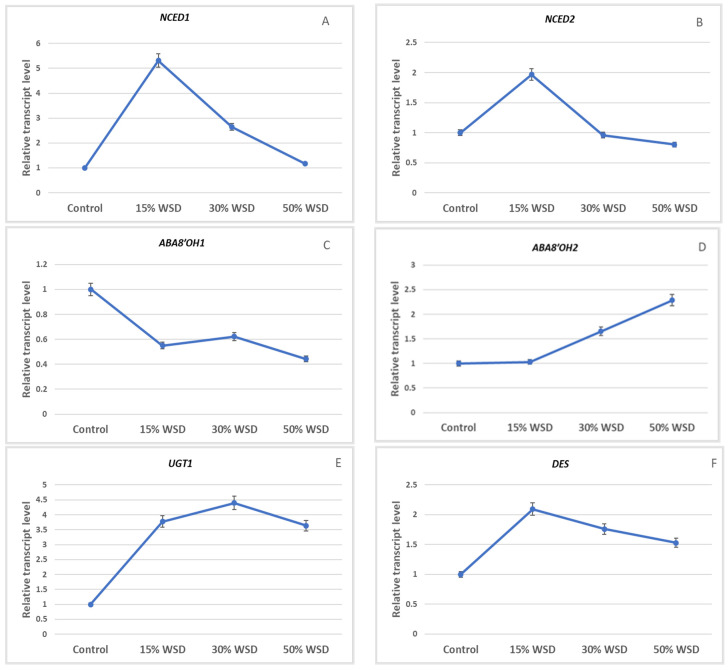
Figure 5.
Transcript levels of NCED1 (A), NCED2 (B), ABA8′OH1 (C), ABA8′OH2 (D), UGT1 (E) and DES (F) in the control and dehydrated plants to 15%, 30%, and 50% WSD. Vertical bars indicate means ± standard deviation of at least three technical replicates of semi-quantitative reverse transcription-PCR performed for each of the two biological replicates.

